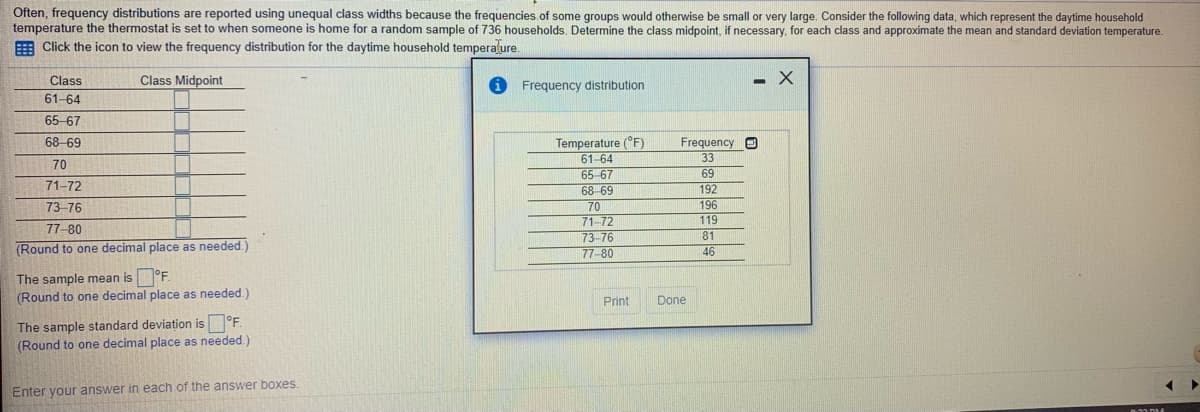
Often, frequency distributions are reported using unequal class widths because temperature the thermostat is set to when someone is home for a random sample of 736 households. Determine the class midpoint, if necessary, for each class and approximate the mean and standard deviation temperature. E Click the icon to view the frequency distribution for the daytime household tempera ure frequencies of some groups would otherwise be small or very large. Consider the following data, which represent the daytime household Class Class Midpoint - X Frequency distribution 61-64 65-67 Temperature (°F) 61-64 65 67 68-69 70 71-72 73-76 77-80 68-69 Frequency O 33 69 192 70 71-72 196 119 81 46 73-76 77-80 (Round to one decimal place as needed.) The sample mean is (Round to one decimal place as needed.) Print Done The sample standard deviation is °F. (Round to one decimal place as needed.) Enter your answer in each of the answer boxes.


Inverse Normal Distribution
The method used for finding the corresponding z-critical value in a normal distribution using the known probability is said to be an inverse normal distribution. The inverse normal distribution is a continuous probability distribution with a family of two parameters.
Mean, Median, Mode
It is a descriptive summary of a data set. It can be defined by using some of the measures. The central tendencies do not provide information regarding individual data from the dataset. However, they give a summary of the data set. The central tendency or measure of central tendency is a central or typical value for a probability distribution.
Z-Scores
A z-score is a unit of measurement used in statistics to describe the position of a raw score in terms of its distance from the mean, measured with reference to standard deviation from the mean. Z-scores are useful in statistics because they allow comparison between two scores that belong to different normal distributions.


Trending now
This is a popular solution!

Step by step
Solved in 2 steps with 2 images


