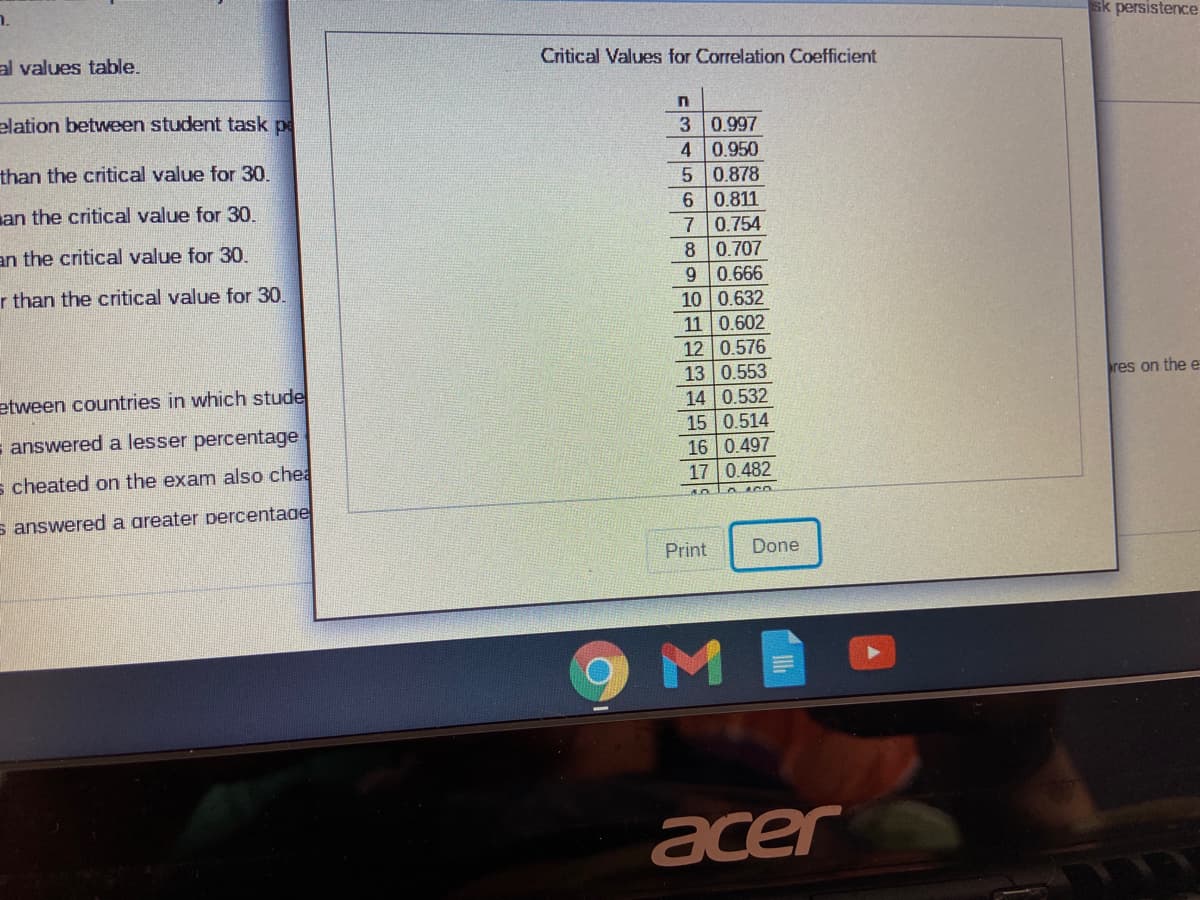
On an international exam, students are asked to respond to a variety of background questions. For the 41 nations that participated in the exam, the correlation between the percentage of items answered in the background questionnaire (used as a proxy for student task persistence) and mean score on the exam was 0.894. Does this suggest there is a linear relation between student task persistence and achievement score? Write a sentence that explains what this result might mean. E Click the icon to view the critical values table. Does this suggest there is a linear relation between student task persistence and achievement score? Choose the best response below. O A. No, since 0.894 is greater than the critical value for 30. O B. Yes, since 0.894 is less than the critical value for 30. O C. No, since 0.894| is less than the critical value for 30. O D. Yes, since 0.894 is greater than the critical value for 30 What does this result mean? O A. There is no linear relation between countries in which students answered a greater percentage of items in the background questionnaire and higher mean scores on the exam, O B. Countries in which students answered a lesser percentage of items in the background questionnaire tended to have higher mean scores on the exam. O C. Countries in which students cheated on the exam also cheated on the items in the background questionnaire O D. Countries in which students answered a areater percentaoe of items in the backaround auestionnaire tended to have hiaher mean scores on the exam.


Correlation
Correlation defines a relationship between two independent variables. It tells the degree to which variables move in relation to each other. When two sets of data are related to each other, there is a correlation between them.
Linear Correlation
A correlation is used to determine the relationships between numerical and categorical variables. In other words, it is an indicator of how things are connected to one another. The correlation analysis is the study of how variables are related.
Regression Analysis
Regression analysis is a statistical method in which it estimates the relationship between a dependent variable and one or more independent variable. In simple terms dependent variable is called as outcome variable and independent variable is called as predictors. Regression analysis is one of the methods to find the trends in data. The independent variable used in Regression analysis is named Predictor variable. It offers data of an associated dependent variable regarding a particular outcome.


Trending now
This is a popular solution!

Step by step
Solved in 2 steps


