On the basis of the above data, you are required tó calculate following ratios and interpret them as briefly 1) Current Ratio. 2) Gross Profit Ratio. 3) Quick Ratio FN ås possible:
On the basis of the above data, you are required tó calculate following ratios and interpret them as briefly 1) Current Ratio. 2) Gross Profit Ratio. 3) Quick Ratio FN ås possible:

Chapter12: Sequences, Series And Binomial Theorem
Section12.3: Geometric Sequences And Series
Problem 12.58TI: What is the total effect on the economy of a government tax rebate of $500 to each household in...

Related questions
Question
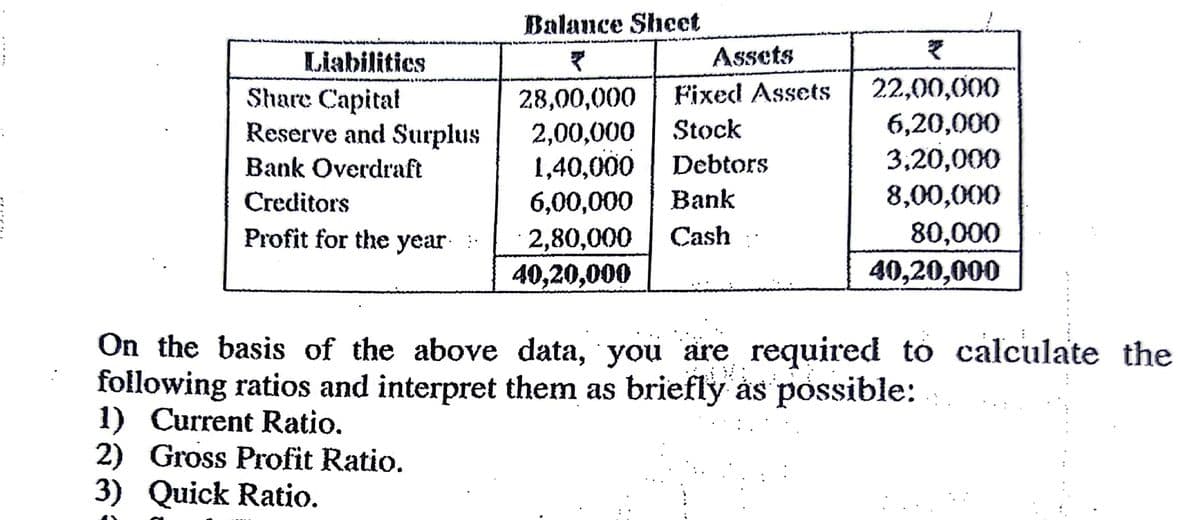
Transcribed Image Text:Balance Shcet
Liabilitics
Assets
22,00,000
Share Capitat
Reserve and Surplus
Fixed Assets
28,00,000
2,00,000
1,40,000
Stock
6,20,000
Bank Overdraft
Debtors
3,20,000
Creditors
6,00,000
Bank
8,00,000
80,000
40,20,000
Profit for the year:
Cash
2,80,000
40,20,000
On the basis of the above data, you are required to calculate the
following ratios and interpret them as briefly ås possible:
1) Current Ratio.
2) Gross Profit Ratio.
3) Quick Ratio.
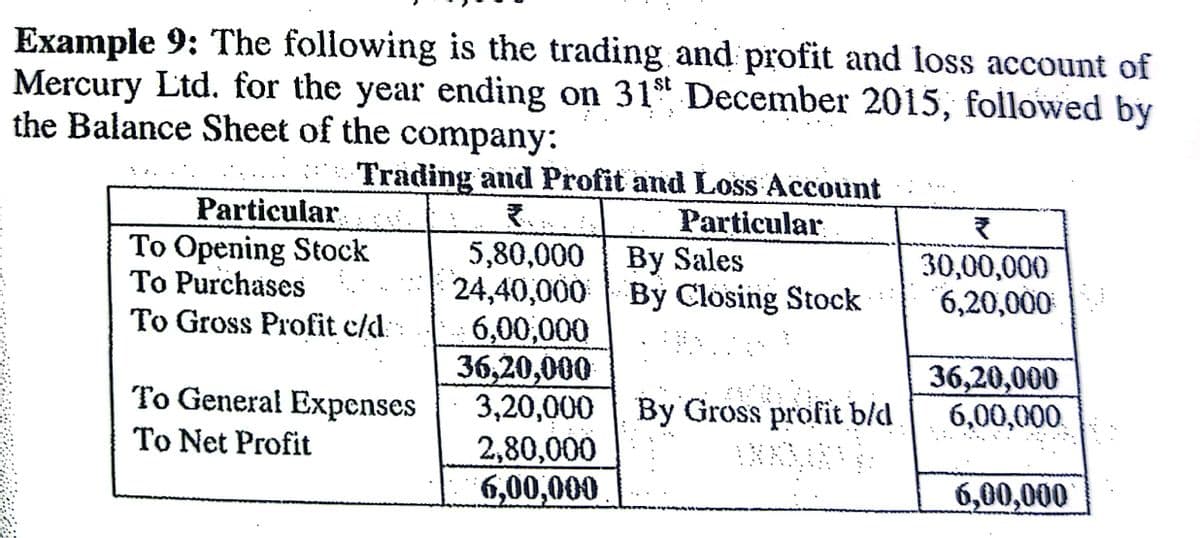
Transcribed Image Text:Example 9: The following is the trading and profit and loss account of
Mercury Ltd. for the year ending on 31" December 2015, followed by
the Balance Sheet of the company:
st
Particular
To Opening Stock
To Purchases
To Gross Profit c/d: 6,00,000
Trading and Profit and Loss Account
Particular
5,80,000 By Sales
24,40,000 By Closing Stock
30,00,000
6,20,000
36,20,000
3,20,000 By Gross profit b/d
2,80,000
6,00,000
36,20,000
6,00,000
To General Expenses
To Net Profit
6,00,000
Expert Solution
This question has been solved!
Explore an expertly crafted, step-by-step solution for a thorough understanding of key concepts.

Step by step
Solved in 3 steps with 2 images

Recommended textbooks for you