

Q: A study was carried out into the attendance rate at a hospital of people in 16 different…
A: Given information: The data represents the values of the variables x = attendance rate and y =…
Q: When estimating distances from a table of velocity data, it is not necessary that the time intervals…
A: Distance is a numerical measurement of how far apart objects or points are. In physics or everyday…
Q: 2. Fit a straight line to the following data and estimate the production in the year 1957. FIG. 01…
A: Calculate Fitting a straight line - Curve fitting using Least square method X Y 1951 10 1961…
Q: Given the data below, can you give a point estimate of the passion fruit seeds’ true mean…
A: We know that the point estimate of population mean is sample mean (x̄). Calculation:-
Q: (b) The following data was collected from a person who travelled starting from rest is given in…
A:
Q: From the following figures calculate the female gross reproduction rate if the ratio oi male and…
A:
Q: Examlpe 3: From the following table below: find 1. Standard error of estimate 2. coefficient of…
A: Standard error of estimate is given by, => √summation(Xi- X bar)2/ (n-1) Where n is sample size
Q: On the basis of the above data, you are required tó calculate following ratios and interpret them as…
A: Answer: For the given data
Q: Based on the information in the following table, use the Exponential Smoothing Approach (a 0.3) to…
A: The formula to find the exponential smoothing is given below: Ft+1=αDt+1-αFt
Q: A study was done over a five-year period to determine if the average t number of ticket sales. The…
A: consider x values are Average ticket price and y values are number of seats in billion
Q: A national census is mandated by the Constitution of Pakistan to be held every ten years. After the…
A: Given that: A national census is mandated by the Constitution of Pakistan to be held every ten…
Q: The following table lists the collection of sweet corn production (in 1,000 metric tons) for two…
A: Forward difference formula to find derivative of f(x) at x=a f'(a) = f(a+h)-f(a)h Backward…
Q: Are the collected measurements precise? are the measured data acceptable? Justify your answer based…
A: Given data is appropriate for measures of central tendency to find the standard deviation and…
Q: Define the following twr5: A. Estimation B. Estimator C. Estimate And state the methods used in…
A: Estimator - if we have drawn a sample of size n and wants to draw a conclusion about whole…
Q: A national census is mandated by the Constitution of Pakistan to be held every ten years. After the…
A: at year 1972 i.e. t = 0, P = 65.309 at year 2017, i.e. t = 2017-1972 = 45, P = 207.774
Q: a. Write the results from specification (1) that are presented in figure (2) in the format of a…
A: Note: As per our company guidelines we are supposed to answer only first three sub-parts. Kindly…
Q: At 20% set limit, are the collected measurements precise? are the measured data acceptable? Justify…
A: Assume, xi be the random variable representing the measurements. x be the mean of xi. n be the…
Q: A man walks daily 84 minutes on a track. One day, his speed at each 6-minute interval is determined…
A:
Q: Find correlation in detail with every step. with respect to x,y, and z values as given in the table
A: The correlation is used to understand the strength of association between the two or more variables.…
Q: 5) Find the linear approximation to estimate V7.429. Compare this to the true value and determine if…
A:
Q: (a) Obtain a point estimate for the population proportion of adults in the country aged 18 and older…
A:
Q: A man walks daily 84 minutes on a track. One day, his speed at each 6-minute interval is determined…
A:
Q: Compute ? and find out if age (in years) has a relation to the blood pressure of an individual
A: Use the Excel and Perform the Regression. Followings are the Steps to perform the Regression 1) Open…
Q: From the table (data set) given below, calculate f(0,2) by Lagrange Interpolation method. - 0,2 0,1…
A: The solution is given as
Q: A man walks daily 84 minutes on a track. One day, his speed at each 6-minute interval is determined…
A:
Q: Given are the scores of 10 employees from their 20-point assessment 16 18 10 8 12 15 19 17 167…
A:
Q: A tire manufacturer tested the braking performance of one of its new tire models on a test track.…
A: The parametric test are used when the population follows a normal distribution. If the population is…
Q: Based on the information provided: 1. Calculate a point estimate for the true population average…
A: Ans. Here it is given that , Sample Size = n = 64 and average unemployment…
Q: Based on an appropriate regression model, the distance traveled by the caterpillar after 8.5 minutes…
A: From given data, X Y X*Y X*X 1 15.3 15.3 1 2 30.1 60.2 4 3.5 50.6 177.1 12.25 4 58.1…
Q: Before microwave ovens are sold, the manufacturer must check to ensure that the radiation coming…
A: a) Using the given data take the values of 1 to 25 from x axis , values of 1 to 20 on y-axis and…
Q: A medical trial is conducted to test whether or not a certain drug can treat a certain allergy. Upon…
A: Given, t = 1.311 We have to test whether or not a certain drug can treat a certain allergy.
Q: Interpret the standard curve below. 1.4 1.2- 1.0 - 0.8 0.6 0.4 0.2 0.0 200 400 600 800 1000 1200…
A: Explanation of the answer is as follows
Q: State the conditions in which the separate and combined ratio estimate methods are used instead of…
A: As per the question we have to state the conditions in which the separate and combined ratio…
Q: integrate the following
A:
Q: the critical value of chi-square is what when degrees of freedom equal 4 and a equals .05.?
A: We have to find critical value..
Q: Consider the first four entries presented in the table below, which represent one estimate of the…
A: 46. From the given information, t x 1000 0.31 1250 0.4 1500 0.5 1750 0.79 Consider,…
Q: Consider the following estimated model, where the dependent variable is the log of the hourly wage:…
A: Given: logwage=0.417+0.17educ+0.0295tenure-0.00059tenure2
Q: When estimating distances from a table of velocity data, it is not necessary that the time intervals…
A:
Q: A random sample of 1028 adults in a certain large country was asked "Do you pretty much think…
A: Since you have posted a question with multiple sub-parts, we will solve first three subparts for…
Q: If W denotes the weight (in pounds) of an individual and t denotes time (in weeks), then dW/dt is…
A:
Q: 4. The speed of a car moving along a horizontal highway at intervals of 2 minutes is given in the…
A: Please check step 2 for the solution.
Q: When estimating distances from a table of velocity data, it is not necessary that the time intervals…
A:
Q: Stephen Stigler determined in 1977 that the speed of light is 299,710.5 km/sec. Some measurements of…
A: Given: Mean, μ=299710.5 Level of significance=1% α=0.01 (i) Set the hypothesis: H0: μ=299710.5Ha:…
Q: he table shown to the right for the population growth model for untry. ur decimal places as needed.)…
A: Topic:- growth rate
Q: The value of the ___________ is used to estimate the value of the population parameter.
A: We know that sample is the best estimator of population parameter when the sample is taken randomly…
Q: Find the linear approximation to estimate V7.429. Compare this to the true value and determine if…
A: We have to find liner approximation of 3√(7.429)
Q: Fit a straight line to the values in below table. i 123456NW X; 10 20 30 40 50 60 70 80 25 70 380…
A:
Q: Calculate the consumers sumplos at the indicated unit price P for the demandh equation
A:
Q: When estimating distances from a table of velocity data, it is not necessary that the time intervals…
A:
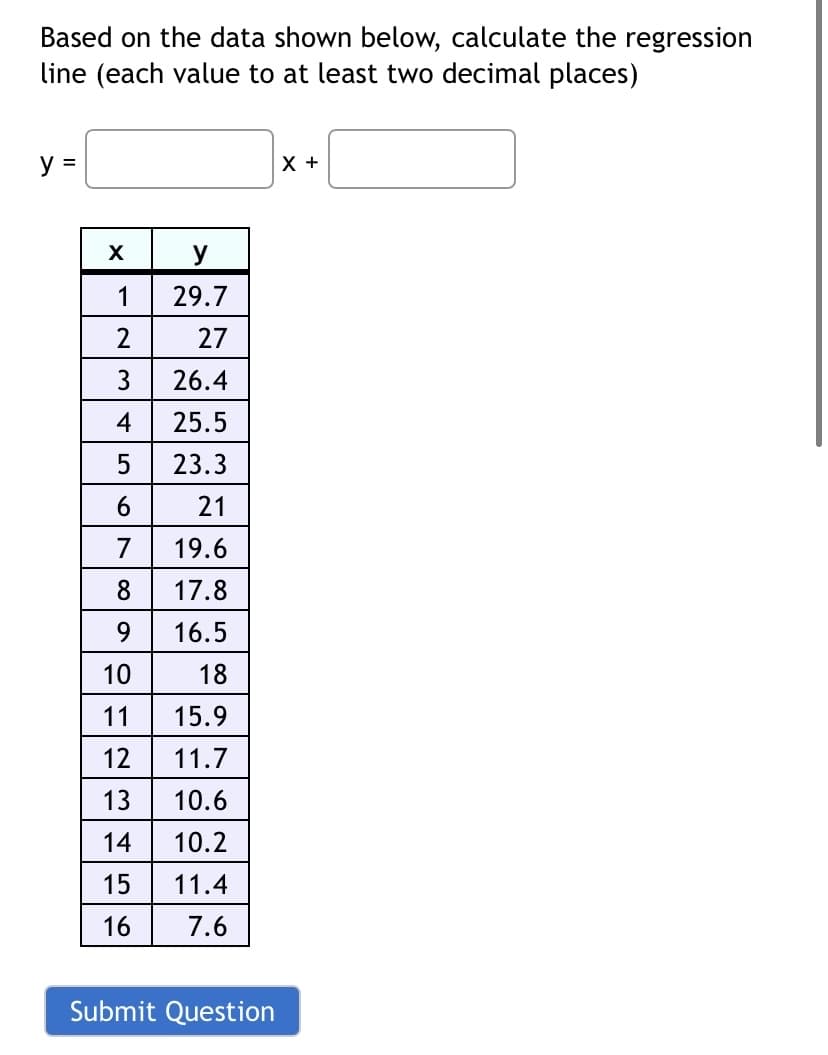
We are asked to find the regression line

Step by step
Solved in 2 steps

- Olympic Pole Vault The graph in Figure 7 indicates that in recent years the winning Olympic men’s pole vault height has fallen below the value predicted by the regression line in Example 2. This might have occurred because when the pole vault was a new event there was much room for improvement in vaulters’ performances, whereas now even the best training can produce only incremental advances. Let’s see whether concentrating on more recent results gives a better predictor of future records. (a) Use the data in Table 2 (page 176) to complete the table of winning pole vault heights shown in the margin. (Note that we are using x=0 to correspond to the year 1972, where this restricted data set begins.) (b) Find the regression line for the data in part ‚(a). (c) Plot the data and the regression line on the same axes. Does the regression line seem to provide a good model for the data? (d) What does the regression line predict as the winning pole vault height for the 2012 Olympics? Compare this predicted value to the actual 2012 winning height of 5.97 m, as described on page 177. Has this new regression line provided a better prediction than the line in Example 2?The following fictitious table shows kryptonite price, in dollar per gram, t years after 2006. t= Years since 2006 0 1 2 3 4 5 6 7 8 9 10 K= Price 56 51 50 55 58 52 45 43 44 48 51 Make a quartic model of these data. Round the regression parameters to two decimal places.If the standard error of the estimate for a regression model fitted to a large number of paired observations is 1.75, approximately 95% of the residuals would lie within ______. −3.50 and +3.50 −1.75 and +1.75 −0.95 and +0.95 −0.68 and +0.68 −0.97 and +0.97
- Which of the following does not need to be computed to determine a simple regression line? SSx SP "Y-hat" SSyUsing the regression line attached. Based on only the above plot, one can conclude: a) height causes an increase in weight b) weight causes an increase in height c) taller people are more likely to weigh more than shorter people, at least in the sample on which this data is based d) a statistically significant predictive relationship between height and weight e) c and dThe following data shows the dexterity test scores of five assembly-line employees of Dimples Company Limited and their respective hourly productivity.Employee Score on dexterity test (?) Ali 12Kofi 14Kwesi 17Abudu 16Nana 11Units produced in an hour (?) 55636770 51You are required to(i) Write the regression equation(ii) Interpret the regression equation(iii) Calculate the Pearson’s Product Moment Correlation Coefficient.(iv) Interpret the correlation coefficient (v) Suppose the dexterity test score is 13, what would be the units produced in an hour? (vi) Clearly explain (in detail) the difference between regression analysis and correlation analysis.
- Consider the following hypothetical regression, with FAIL? as a dummy variable for if a business failed in its first year (1=failed, 0=didn’t fail); LOAN is how much money, in thousands of dollars, the business got as a loan when it started; GIG? is a dummy variable for if there was a gig economy job available, such as driving for Lyft (1=available, 0=not available), and COMP is the number of existing competitors the business faced when it started. All variables are statistically significant. FAIL? = 0.63 – 0.01*LOAN – 0.08*GIG? + 0.05*COMP Answer the following: Determine the predicted value of FAIL? if the business had a $30,000 loan, there was no gig economy, and four competitors. In everyday language, what does the estimated value found in A mean? If a business gets an additional six thousand dollars in loans, how would FAIL? change? Give the “punchline” interpretation of the COMP variable: “For every additional competitor…”Consider the following table of N=3 observations. Calculate estimates of b1 and b0 (b-hat) considering the linear regression model y=b+b*x Compute SSE for this regression Assume that SST=32. What is R^2 for this regression?In the following model, "employed" is a dummy indicating a person is employed: donation = B + B edu + Bemployed + uT Running this model will produce the same results of differential in donation between employed people and unemployed people as running two separate regressions for employed people and unemployed people. A. True B. False
- Which of the following best describes a regression coefficient in a bivariate setting? a. The change in Y predicted by a unit change in X b. The slope of a line that minimizes the sum of squared residuals c. The correlation coefficient multiplied by SDy/SDx d. All of the aboveBased on the data shown below, calculate the regression line (each value to at least two decimal places)y = x + x y 2 19.55 3 18.7 4 19.25 5 17.3 6 19.85 7 18.9 8 18.85 9 18.3 10 15.35 11 16.2 12 18.35 13 14.7The following data is a regression model where the U.S. Department of Transportation has tried to relate the rate of fatal traffic accidents (per 1000 licenses) to the percentage of motorists under the age of 21. Data has been collected for 42 major cities in the United States. SUMMARY OUTPUT Regression Statistics Multiple R 0.83938748 R Square 0.70457134 Adjusted R Square 0.69718562 Standard Error 0.58935028 Observations 42 ANOVA df SS MS F Regression 1 33.13441764 33.1344 95.3964 Residual 40 13.89335048 0.34733 Total 41 47.02776812 Coefficients Standard Error t Stat P-value Intercept -1.5974138 0.371671454 -4.2979 0.00010 Percent Under 21 0.28705317 0.029389769 9.76711 3.79E-9…

