On the following graph illustrate the impact of a sudden decline in consumer confidence that reduces autonomous consumption by $50 billion. Assume MPC = 0.8. 2. (a) What is the new equilibrium level of real output? (Don't forget the multiplier.) (b) How large is the real GDP gap? (c) What has happened to average prices? AS AD 50100 200 300 400 500 600 700 REAL OUTPUT (in billions of dollars per year) PRICE LEVEL (average price)
On the following graph illustrate the impact of a sudden decline in consumer confidence that reduces autonomous consumption by $50 billion. Assume MPC = 0.8. 2. (a) What is the new equilibrium level of real output? (Don't forget the multiplier.) (b) How large is the real GDP gap? (c) What has happened to average prices? AS AD 50100 200 300 400 500 600 700 REAL OUTPUT (in billions of dollars per year) PRICE LEVEL (average price)

Chapter11: Fiscal Policy
Section: Chapter Questions
Problem 11E

Related questions
Question
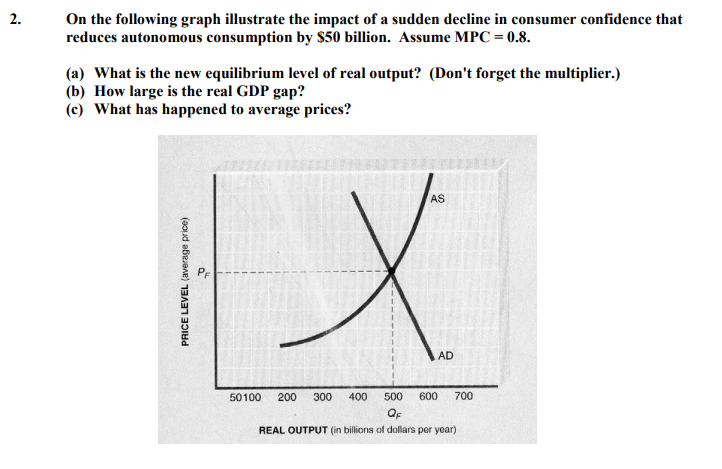
Transcribed Image Text:On the following graph illustrate the impact of a sudden decline in consumer confidence that
reduces autonomous consumption by $50 billion. Assume MPC = 0.8.
2.
(a) What is the new equilibrium level of real output? (Don't forget the multiplier.)
(b) How large is the real GDP gap?
(c) What has happened to average prices?
AS
AD
50100
200
300
400
500
600
700
REAL OUTPUT (in billions of dollars per year)
PRICE LEVEL (average price)
Expert Solution
This question has been solved!
Explore an expertly crafted, step-by-step solution for a thorough understanding of key concepts.

This is a popular solution!

Trending now
This is a popular solution!

Step by step
Solved in 3 steps with 4 images

Knowledge Booster


Learn more about
Need a deep-dive on the concept behind this application? Look no further. Learn more about this topic, economics and related others by exploring similar questions and additional content below.Recommended textbooks for you


