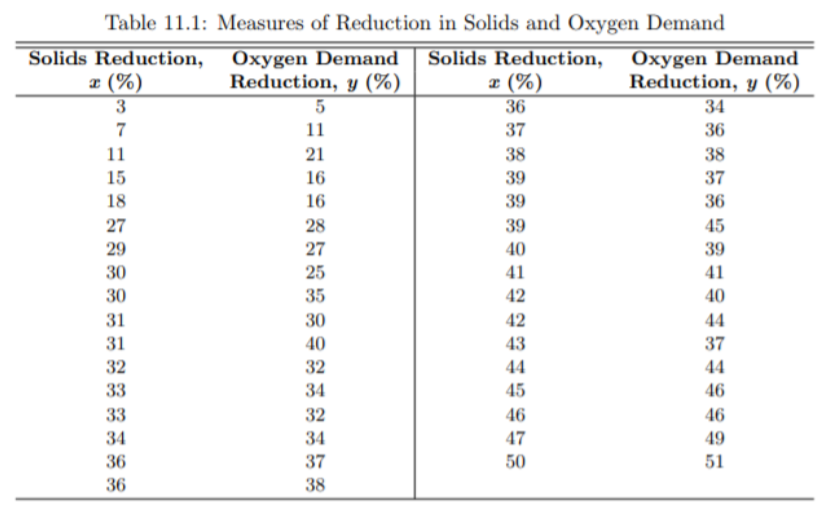
One of the more challenging problems confronting the water pollution control field is presented by the tanning industry. Tannery wastes are chemically complex. They are characterized by high values of biochemical oxygen demand, volatile solids, and other pollution measures. A study conducted by Virginia Polytechnic Institute and State University measured the percent reduction in total solids (x) and percent reduction in chemical oxygen demand (y) of 33 samples of chemically treated waste. a. Compute the value of Sxx, Syy, Sxy, and r. b. Determine the regression line model/equation. c. Determine the coefficient of determination r 2 Explain the meaning of this quantity in the context of this problem. d. Using α = 0.01, test H0 : β1 = 0 vs. H1 : β1 6= 0 e. Imagine that the next solid reduction level is at 54%. what would be your best estimate of the oxygen demand reduction?


One of the more challenging problems confronting the water pollution control field is presented
by the tanning industry. Tannery wastes are chemically complex. They are characterized by high
values of biochemical oxygen demand, volatile solids, and other pollution measures. A study
conducted by Virginia Polytechnic Institute and State University measured the percent reduction
in total solids (x) and percent reduction in chemical oxygen demand (y) of 33 samples of
chemically treated waste.
a. Compute the value of Sxx, Syy, Sxy, and r.
b. Determine the regression line model/equation.
c. Determine the coefficient of determination r 2 Explain the meaning of this quantity in the context of
this problem.
d. Using α = 0.01, test H0 : β1 = 0 vs. H1 : β1 6= 0
e. Imagine that the next solid reduction level is at 54%. what would be your best estimate of the oxygen
demand reduction?


Trending now
This is a popular solution!

Step by step
Solved in 6 steps with 6 images

