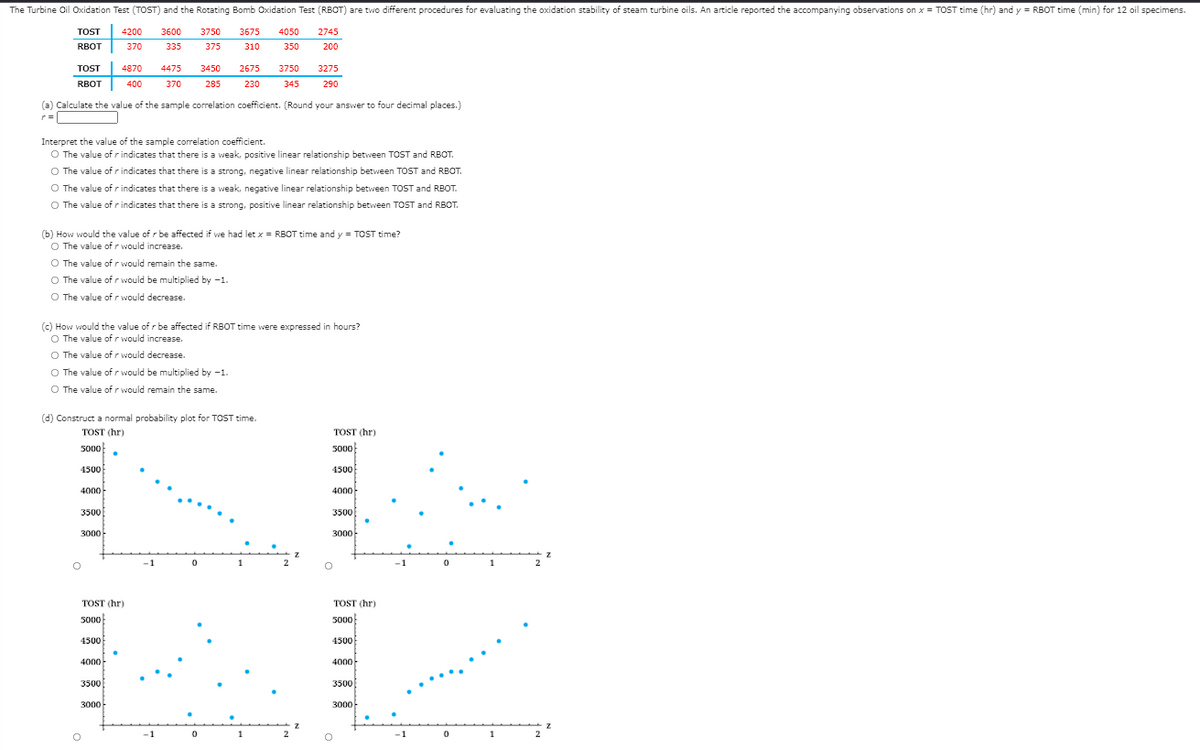
The Turbine Oil Oxidation Test (TOST) and the Rotating Bomb Oxidation Test (RBOT) are two different procedures for evaluating the oxidation stability of steam turbine oils. An article reported the accompanying observations on x = TOST time (hr) and y = RBOT time (min) for 12 oil specimens. TOST 4200 3600 3750 3675 4050 2745 RBOT 370 335 375 310 350 200 TOST 4870 4475 3450 2675 3750 3275 RBOT 400 370 285 230 345 290 (a) Calculate the value of the sample correlation coefficient. (Round your answer to four decimal places.) Interpret the value of the sample correlation coefficient. O The value of r indicates that there is a weak, positive linear relationship between TOST and RBOT. O The value of r indicates that there is a strong, negative linear relationship between TOST and RBOT. O The value of r indicates that there is a weak, negative linear relationship between TOST and RBOT. O The value of r indicates that there is a strong, positive linear relationship between TOST and RBOT. (b) How would the value of r be affected if we had let x- RBOT time and y = TOST time? O The value of r would increase. O The value of r would remain the same. O The value of r would be multiplied by -1. O The value of r would decrease. (c) How would the value of r be affected if RBOT time were expressed in hours? O The value of r would increase. O The value of r would decrease. O The value of r would be multiplied by -1. O The value of r would remain the same.
The Turbine Oil Oxidation Test (TOST) and the Rotating Bomb Oxidation Test (RBOT) are two different procedures for evaluating the oxidation stability of steam turbine oils. An article reported the accompanying observations on x = TOST time (hr) and y = RBOT time (min) for 12 oil specimens. TOST 4200 3600 3750 3675 4050 2745 RBOT 370 335 375 310 350 200 TOST 4870 4475 3450 2675 3750 3275 RBOT 400 370 285 230 345 290 (a) Calculate the value of the sample correlation coefficient. (Round your answer to four decimal places.) Interpret the value of the sample correlation coefficient. O The value of r indicates that there is a weak, positive linear relationship between TOST and RBOT. O The value of r indicates that there is a strong, negative linear relationship between TOST and RBOT. O The value of r indicates that there is a weak, negative linear relationship between TOST and RBOT. O The value of r indicates that there is a strong, positive linear relationship between TOST and RBOT. (b) How would the value of r be affected if we had let x- RBOT time and y = TOST time? O The value of r would increase. O The value of r would remain the same. O The value of r would be multiplied by -1. O The value of r would decrease. (c) How would the value of r be affected if RBOT time were expressed in hours? O The value of r would increase. O The value of r would decrease. O The value of r would be multiplied by -1. O The value of r would remain the same.

MATLAB: An Introduction with Applications
6th Edition
ISBN:9781119256830
Author:Amos Gilat
Publisher:Amos Gilat
Chapter1: Starting With Matlab
Section: Chapter Questions
Problem 1P

Related questions
Question
Transcribed Image Text:The Turbine Oil Oxidation Test (TOST) and the Rotating Bomb Oxidation Test (RBOT) are two different procedures for evaluating the oxidation stability of steam turbine oils. An article reported the accompanying observations on x = TOST time (hr) and y = RBOT time (min) for 12 oil specimens.
TOST
4200
3600
3750
3675
4050
2745
RBOT
370
335
375
310
350
200
TOST
4870
4475
3450
2675
3750
3275
RBOT
400
370
285
230
345
290
(a) Calculate the value of the sample correlation coefficient. (Round your answer to four decimal places.)
r3=
Interpret the value of the sample correlation coefficient.
O The value of rindicates that there is a weak, positive linear relationship between TOST and RBOT.
O The value of r indicates that there is a strong, negative linear relationship between TOST and RBOT.
O The value of r indicates that there is a weak, negative linear relationship between TOST and RBOT.
O The value of rindicates that there is a strong, positive linear relationship between TOST and RBOT.
(b) How would the value of r be affected if we had let x = RBOT time and y = TOST time?
O The value of r would increase.
O The value of r would remain the same.
O The value of r would be multiplied by -1.
O The value of r would decrease.
(c) How would the value of r be affected if RBOT time were expressed in hours?
O The value of r would increase.
O The value ofr would decrease.
O The value of r would be multiplied by -1.
O The value of r would remain the same.
(d) Construct a normal probability plot for TOST time.
TOST (hr)
TOST (hr)
5000
5000
4500
4500
4000-
4000-
3500
3500
3000
3000
-1
1
-1
1
TOST (hr)
TOST (hr)
500
5000
4500
4500
4000
4000
3500
3500
3000
3000-
-1
2
-1
1
Expert Solution
This question has been solved!
Explore an expertly crafted, step-by-step solution for a thorough understanding of key concepts.

This is a popular solution!

Trending now
This is a popular solution!

Step by step
Solved in 4 steps with 1 images

Recommended textbooks for you
MATLAB: An Introduction with Applications
Statistics
ISBN:
9781119256830
Author:
Amos Gilat
Publisher:
John Wiley & Sons Inc

Probability and Statistics for Engineering and th…
Statistics
ISBN:
9781305251809
Author:
Jay L. Devore
Publisher:
Cengage Learning

Statistics for The Behavioral Sciences (MindTap C…
Statistics
ISBN:
9781305504912
Author:
Frederick J Gravetter, Larry B. Wallnau
Publisher:
Cengage Learning
MATLAB: An Introduction with Applications
Statistics
ISBN:
9781119256830
Author:
Amos Gilat
Publisher:
John Wiley & Sons Inc
Probability and Statistics for Engineering and th…
Statistics
ISBN:
9781305251809
Author:
Jay L. Devore
Publisher:
Cengage Learning
Statistics for The Behavioral Sciences (MindTap C…
Statistics
ISBN:
9781305504912
Author:
Frederick J Gravetter, Larry B. Wallnau
Publisher:
Cengage Learning

Elementary Statistics: Picturing the World (7th E…
Statistics
ISBN:
9780134683416
Author:
Ron Larson, Betsy Farber
Publisher:
PEARSON

The Basic Practice of Statistics
Statistics
ISBN:
9781319042578
Author:
David S. Moore, William I. Notz, Michael A. Fligner
Publisher:
W. H. Freeman

Introduction to the Practice of Statistics
Statistics
ISBN:
9781319013387
Author:
David S. Moore, George P. McCabe, Bruce A. Craig
Publisher:
W. H. Freeman