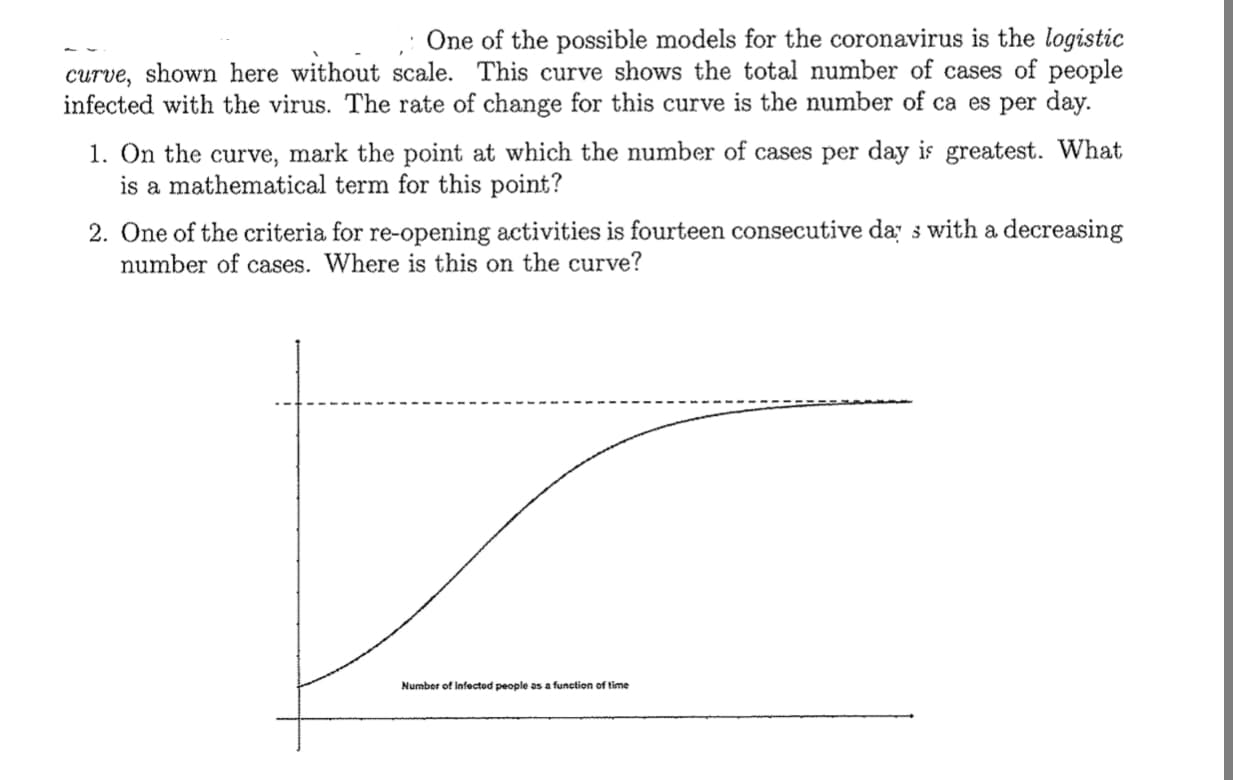
One of the possible models for the coronavirus is the logistic curve, shown here without scale. This curve shows the total number of cases of people infected with the virus. The rate of change for this curve is the number of ca es per day. 1. On the curve, mark the point at which the number of cases per day is greatest. What is a mathematical term for this point? 2. One of the criteria for re-opening activities is fourteen consecutive da s with a decreasing number of cases. Where is this on the curve? Number of Infected people as a function of time
One of the possible models for the coronavirus is the logistic curve, shown here without scale. This curve shows the total number of cases of people infected with the virus. The rate of change for this curve is the number of ca es per day. 1. On the curve, mark the point at which the number of cases per day is greatest. What is a mathematical term for this point? 2. One of the criteria for re-opening activities is fourteen consecutive da s with a decreasing number of cases. Where is this on the curve? Number of Infected people as a function of time

Chapter6: Exponential And Logarithmic Functions
Section6.8: Fitting Exponential Models To Data
Problem 3TI: Table 6 shows the population, in thousands, of harbor seals in the Wadden Sea over the years 1997 to...

Related questions
Question
Transcribed Image Text:One of the possible models for the coronavirus is the logistic
curve, shown here without scale. This curve shows the total number of cases of people
infected with the virus. The rate of change for this curve is the number of ca es per day.
1. On the curve, mark the point at which the number of cases per day is greatest. What
is a mathematical term for this point?
2. One of the criteria for re-opening activities is fourteen consecutive da s with a decreasing
number of cases. Where is this on the curve?
Number of Infected people as a function of time
Expert Solution
Step 1
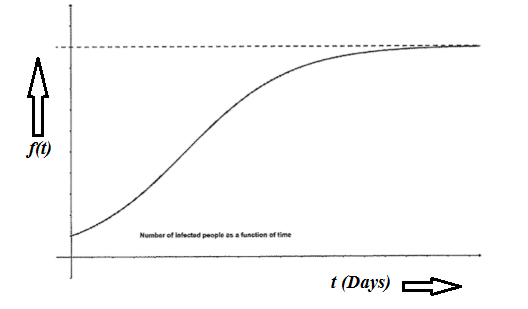
Label the graph as per the given statements in the question.
Step 2
The rate of change is the number of cases per day.
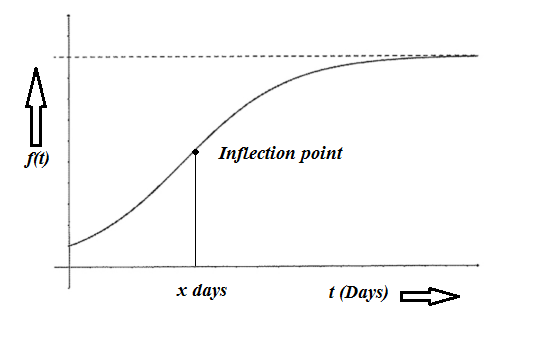
From the graph, the rate is maximum when concavity for f (t) changes from concavity up to concavity down.
This point is called the point of inflection.
Mark the point for inflection in the curve.

Step by step
Solved in 3 steps with 3 images

Recommended textbooks for you

College Algebra (MindTap Course List)
Algebra
ISBN:
9781305652231
Author:
R. David Gustafson, Jeff Hughes
Publisher:
Cengage Learning

Algebra & Trigonometry with Analytic Geometry
Algebra
ISBN:
9781133382119
Author:
Swokowski
Publisher:
Cengage
College Algebra (MindTap Course List)
Algebra
ISBN:
9781305652231
Author:
R. David Gustafson, Jeff Hughes
Publisher:
Cengage Learning
Algebra & Trigonometry with Analytic Geometry
Algebra
ISBN:
9781133382119
Author:
Swokowski
Publisher:
Cengage