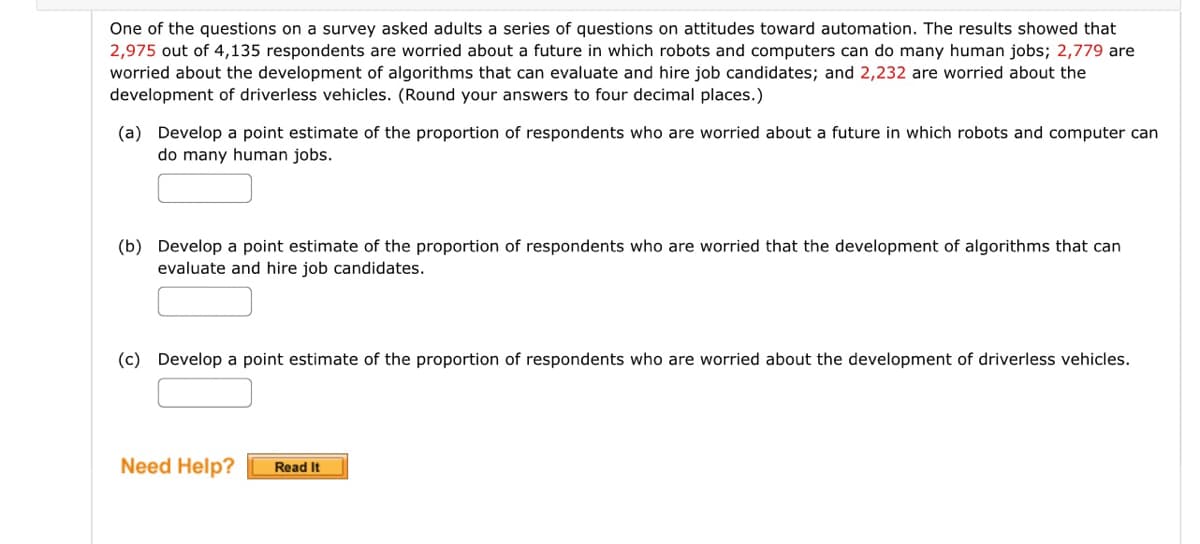
One of the questions on a survey asked adults a series of questions on attitudes toward automation. The results showed that 2,975 out of 4,135 respondents are worried about a future in which robots and computers can do many human jobs; 2,779 are worried about the development of algorithms that can evaluate and hire job candidates; and 2,232 are worried about the development of driverless vehicles. (Round your answers to four decimal places.) (a) Develop a point estimate of the proportion of respondents who are worried about a future in which robots and computer can do many human jobs. (b) Develop a point estimate of the proportion of respondents who are worried that the development of algorithms that can evaluate and hire job candidates. (c) Develop a point estimate of the proportion of respondents who are worried about the development of driverless vehicles. Need Help? Read It
One of the questions on a survey asked adults a series of questions on attitudes toward automation. The results showed that 2,975 out of 4,135 respondents are worried about a future in which robots and computers can do many human jobs; 2,779 are worried about the development of algorithms that can evaluate and hire job candidates; and 2,232 are worried about the development of driverless vehicles. (Round your answers to four decimal places.) (a) Develop a point estimate of the proportion of respondents who are worried about a future in which robots and computer can do many human jobs. (b) Develop a point estimate of the proportion of respondents who are worried that the development of algorithms that can evaluate and hire job candidates. (c) Develop a point estimate of the proportion of respondents who are worried about the development of driverless vehicles. Need Help? Read It

Linear Algebra: A Modern Introduction
4th Edition
ISBN:9781285463247
Author:David Poole
Publisher:David Poole
Chapter2: Systems Of Linear Equations
Section2.2: Direct Methods For Solving Linear Systems
Problem 2CEXP

Related questions
Question
Transcribed Image Text:One of the questions on a survey asked adults a series of questions on attitudes toward automation. The results showed that
2,975 out of 4,135 respondents are worried about a future in which robots and computers can do many human jobs; 2,779 are
worried about the development of algorithms that can evaluate and hire job candidates; and 2,232 are worried about the
development of driverless vehicles. (Round your answers to four decimal places.)
(a) Develop a point estimate of the proportion of respondents who are worried about a future in which robots and computer can
do many human jobs.
(b) Develop a point estimate of the proportion of respondents who are worried that the development of algorithms that can
evaluate and hire job candidates.
(c) Develop a point estimate of the proportion of respondents who are worried about the development of driverless vehicles.
Need Help? Read It
Expert Solution
This question has been solved!
Explore an expertly crafted, step-by-step solution for a thorough understanding of key concepts.

This is a popular solution!

Trending now
This is a popular solution!

Step by step
Solved in 2 steps with 2 images

Recommended textbooks for you
Linear Algebra: A Modern Introduction
Algebra
ISBN:
9781285463247
Author:
David Poole
Publisher:
Cengage Learning
Linear Algebra: A Modern Introduction
Algebra
ISBN:
9781285463247
Author:
David Poole
Publisher:
Cengage Learning