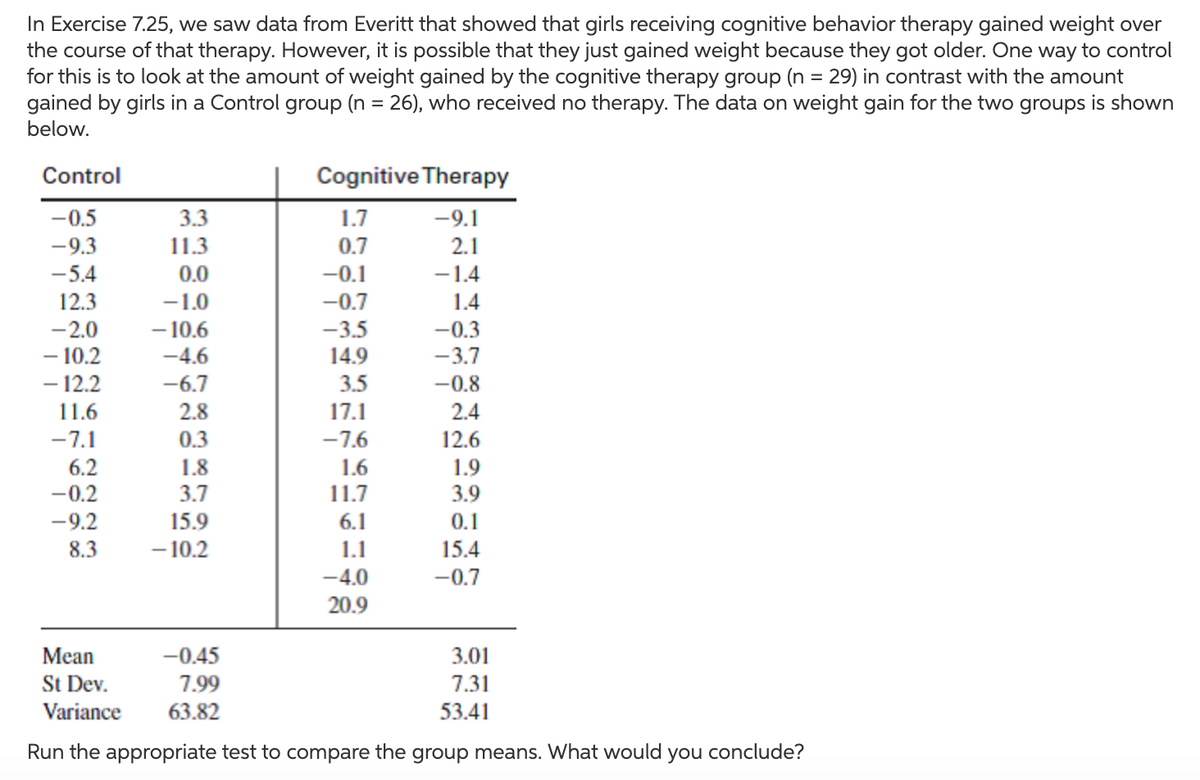
In Exercise 7.25, we saw data from Everitt that showed that girls receiving cognitive behavior therapy gained weight over the course of that therapy. However, it is possible that they just gained weight because they got older. One way to control for this is to look at the amount of weight gained by the cognitive therapy group (n = 29) in contrast with the amount gained by girls in a Control group (n = 26), who received no therapy. The data on weight gain for the two groups is shown below. Control Cognitive Therapy -0.5 3.3 1.7 -9.1 -9.3 11.3 0.0 0.7 2.1 -5.4 -0.1 -1.4 12.3 -2.0 -1.0 -0.7 1.4 -0.3 - 10.6 -4.6 -3.5 - 10.2 - 12.2 14.9 -3.7 -6.7 3.5 17.1 -7.6 -0.8 11.6 2.8 2.4 -7.1 0.3 12.6 6.2 1.8 1.6 1.9 -0.2 3.7 11.7 3.9 -9.2 15.9 6.1 0.1 8.3 - 10.2 1.1 15.4 -4.0 -0.7 20.9 3.01 7.31 Mean -0.45 St Dev. 7.99 Variance 63.82 53.41 Run the appropriate test to compare the group means. What would you conclude?
In Exercise 7.25, we saw data from Everitt that showed that girls receiving cognitive behavior therapy gained weight over the course of that therapy. However, it is possible that they just gained weight because they got older. One way to control for this is to look at the amount of weight gained by the cognitive therapy group (n = 29) in contrast with the amount gained by girls in a Control group (n = 26), who received no therapy. The data on weight gain for the two groups is shown below. Control Cognitive Therapy -0.5 3.3 1.7 -9.1 -9.3 11.3 0.0 0.7 2.1 -5.4 -0.1 -1.4 12.3 -2.0 -1.0 -0.7 1.4 -0.3 - 10.6 -4.6 -3.5 - 10.2 - 12.2 14.9 -3.7 -6.7 3.5 17.1 -7.6 -0.8 11.6 2.8 2.4 -7.1 0.3 12.6 6.2 1.8 1.6 1.9 -0.2 3.7 11.7 3.9 -9.2 15.9 6.1 0.1 8.3 - 10.2 1.1 15.4 -4.0 -0.7 20.9 3.01 7.31 Mean -0.45 St Dev. 7.99 Variance 63.82 53.41 Run the appropriate test to compare the group means. What would you conclude?

Linear Algebra: A Modern Introduction
4th Edition
ISBN:9781285463247
Author:David Poole
Publisher:David Poole
Chapter7: Distance And Approximation
Section7.3: Least Squares Approximation
Problem 31EQ

Related questions
Topic Video
Question
Transcribed Image Text:In Exercise 7.25, we saw data from Everitt that showed that girls receiving cognitive behavior therapy gained weight over
the course of that therapy. However, it is possible that they just gained weight because they got older. One way to control
for this is to look at the amount of weight gained by the cognitive therapy group (n = 29) in contrast with the amount
gained by girls in a Control group (n = 26), who received no therapy. The data on weight gain for the two groups is shown
below.
Control
Cognitive Therapy
-0.5
3.3
1.7
-9.1
-9.3
11.3
0.7
2.1
-5.4
0.0
-0.1
-1.4
12.3
-1.0
-0.7
1.4
-2.0
- 10.6
-3.5
-0.3
-3.7
- 10.2
- 12.2
-4.6
14.9
-6.7
3.5
-0.8
11.6
2.8
17.1
2.4
-7.1
0.3
-7.6
12.6
6.2
-0.2
1.8
1.6
1.9
3.7
11.7
3.9
-9.2
15.9
6.1
0.1
8.3
- 10.2
1.1
15.4
-4.0
-0.7
20.9
Мean
-0.45
3.01
St Dev.
7.99
7.31
Variance
63.82
53.41
Run the appropriate test to compare the group means. What would
you
conclude?
Expert Solution
Step 1
Set up,

Trending now
This is a popular solution!

Step by step
Solved in 5 steps

Knowledge Booster


Learn more about
Need a deep-dive on the concept behind this application? Look no further. Learn more about this topic, statistics and related others by exploring similar questions and additional content below.Recommended textbooks for you
Linear Algebra: A Modern Introduction
Algebra
ISBN:
9781285463247
Author:
David Poole
Publisher:
Cengage Learning

Glencoe Algebra 1, Student Edition, 9780079039897…
Algebra
ISBN:
9780079039897
Author:
Carter
Publisher:
McGraw Hill
Linear Algebra: A Modern Introduction
Algebra
ISBN:
9781285463247
Author:
David Poole
Publisher:
Cengage Learning
Glencoe Algebra 1, Student Edition, 9780079039897…
Algebra
ISBN:
9780079039897
Author:
Carter
Publisher:
McGraw Hill