ormulas.) (a) State the null hypothesis H, and the alternative hypothesis H,. Ho :0 H :0 (b) Determine the type of test statistic to use. (Choose one) ▼ O=0 OSO (c) Find the value of the test statistic. (Round to three or more decimal places.) O
ormulas.) (a) State the null hypothesis H, and the alternative hypothesis H,. Ho :0 H :0 (b) Determine the type of test statistic to use. (Choose one) ▼ O=0 OSO (c) Find the value of the test statistic. (Round to three or more decimal places.) O

MATLAB: An Introduction with Applications
6th Edition
ISBN:9781119256830
Author:Amos Gilat
Publisher:Amos Gilat
Chapter1: Starting With Matlab
Section: Chapter Questions
Problem 1P

Related questions
Question
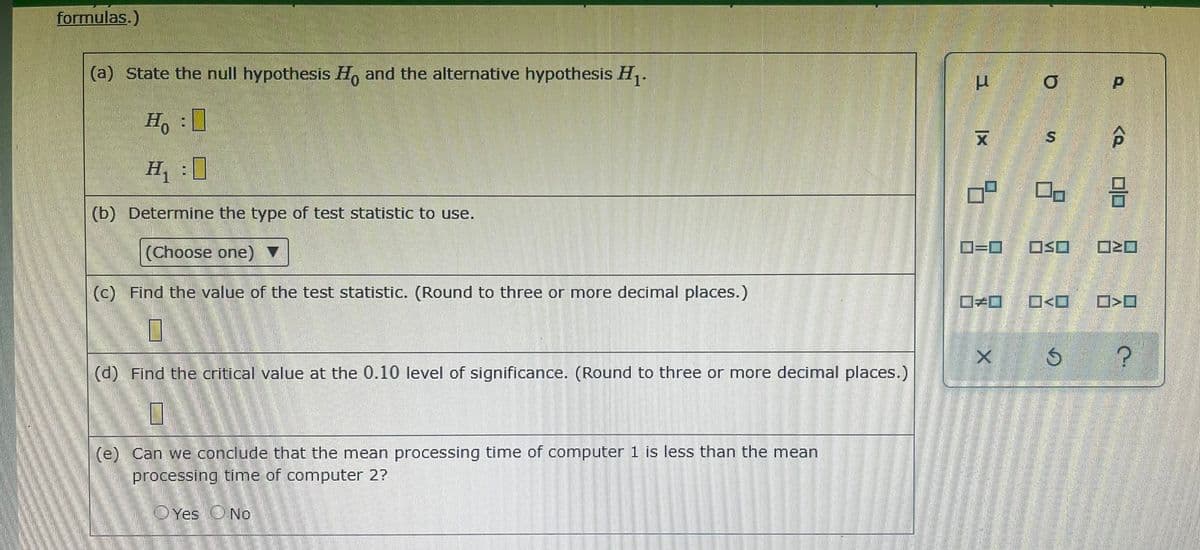
Transcribed Image Text:formulas.)
(a) State the null hypothesis H, and the alternative hypothesis H.
Ho :0
H :0
(b) Determine the type of test statistic to use.
(Choose one) ▼
D=0
OSO
(c) Find the value of the test statistic. (Round to three or more decimal places.)
O<O
ロ>ロ
?
(d) Find the critical value at the 0.10 level of significance. (Round to three or more decimal places.)
(e) Can we conclude that the mean processing time of computer 1 is less than the mean
processing time of computer 2?
OYes
ONo
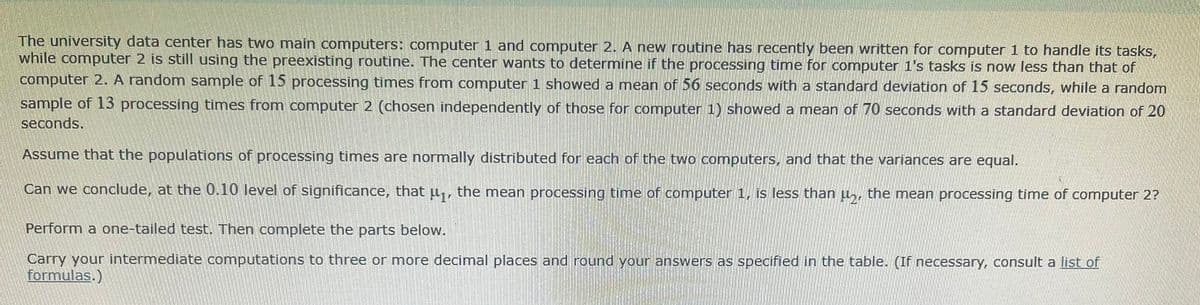
Transcribed Image Text:The university data center has two main computers: computer 1 and computer 2. A new routine has recently been written for computer 1 to handle its tasks,
while computer 2 is still using the preexisting routine. The center wants to determine if the processing time for computer 1's tasks is now less than that of
computer 2. A random sample of 15 processing times from computer 1 showed a mean of 56 seconds with a standard deviation of 15 seconds, while a random
sample of 13 processing times from computer 2 (chosen independently of those for computer 1) showed a mean of 70 seconds with a standard deviation of 20
seconds.
Assume that the populations of processing times are normally distributed for each of the two computers, and that the variances are equal.
Can we conclude, at the 0.10 level of significance, that u,, the mean processing time of computer 1, is less than µ,, the mean processing time of computer 2?
Perform a one-tailed test. Then complete the parts below.
Carry your intermediate computations to three or more decimal places and round your answers as specified in the table. (If necessary, consult a list of
formulas.)
Expert Solution
This question has been solved!
Explore an expertly crafted, step-by-step solution for a thorough understanding of key concepts.

Step by step
Solved in 2 steps with 2 images

Recommended textbooks for you
MATLAB: An Introduction with Applications
Statistics
ISBN:
9781119256830
Author:
Amos Gilat
Publisher:
John Wiley & Sons Inc

Probability and Statistics for Engineering and th…
Statistics
ISBN:
9781305251809
Author:
Jay L. Devore
Publisher:
Cengage Learning

Statistics for The Behavioral Sciences (MindTap C…
Statistics
ISBN:
9781305504912
Author:
Frederick J Gravetter, Larry B. Wallnau
Publisher:
Cengage Learning
MATLAB: An Introduction with Applications
Statistics
ISBN:
9781119256830
Author:
Amos Gilat
Publisher:
John Wiley & Sons Inc
Probability and Statistics for Engineering and th…
Statistics
ISBN:
9781305251809
Author:
Jay L. Devore
Publisher:
Cengage Learning
Statistics for The Behavioral Sciences (MindTap C…
Statistics
ISBN:
9781305504912
Author:
Frederick J Gravetter, Larry B. Wallnau
Publisher:
Cengage Learning

Elementary Statistics: Picturing the World (7th E…
Statistics
ISBN:
9780134683416
Author:
Ron Larson, Betsy Farber
Publisher:
PEARSON

The Basic Practice of Statistics
Statistics
ISBN:
9781319042578
Author:
David S. Moore, William I. Notz, Michael A. Fligner
Publisher:
W. H. Freeman

Introduction to the Practice of Statistics
Statistics
ISBN:
9781319013387
Author:
David S. Moore, George P. McCabe, Bruce A. Craig
Publisher:
W. H. Freeman