owing graph plots aggregate demand (ADyer) and aggregate supply (AS) for the imaginary country of Patagonia in the year 2027. the natural level of output in this economy is $6 trillion. plete the table by entering the inflation rate at each potential outcome point. :: Calculate the inflation rate to two decimal points of precision. following graph, use the green line (triangle symbol) to plot the long-run aggregate supply (LRAS) curve for this economy. LRAS AS AD2027 AD ADE 2 14 OUTPUT (Trillions of dollars) Outcome C ists forecast that if the government takes no action and the economy continues to grow at the current rate, aggregate demand in 2028 will b the curve labeled ADA, resulting in the outcome given by point A. If, however, the government pursues an expansionary policy, aggregate I in 2028 will be given by the curve labeled AD, resulting in the outcome given by point B. owing table presents projections for the unemployment rates that would occur at point A and point B. Consider the potential rate of inflation 12027 and 2029, depending on whether the economy moves from the initial price level of 102 to the price level at outcome A or the price le ime B. At the natural level of output At the natural rate of unemployment Representing the tradeoff between unemployment and inflation Unemployment Rate Inflation Rate 1% 5% d on your answers to the preceding parts, use the black line (plus symbol) to draw the short-run Phillips curve (SRPC) for this economy in 2028 e: You will not be graded on any changes you make to this graph.) INFLATION RATE (Percent 7 0 0 1 2 3 4 8 7 8 UNEMPLOYMENT RATE (Percent) SRPC A LRPC Now consider the long-run effects of this policy. Suppose, in particular, that following implementation of the policy, the aggregate demand curve remains at ADB. The long-run equilibrium that would follow such a policy is designated outcome C. Going back to the first graph, place the grey point (star symbol) at outcome C. Because output at point C is the natural level of output, the unemployment rate associated with outcome C is the natural rate of unemployment. Finally, use the green line (triangle symbol) to draw the long-run Phillips curve (LRPC) on the second graph. This line is line: Representing the tradeoff between unemployment and inflation At the natural rate of unemployment
owing graph plots aggregate demand (ADyer) and aggregate supply (AS) for the imaginary country of Patagonia in the year 2027. the natural level of output in this economy is $6 trillion. plete the table by entering the inflation rate at each potential outcome point. :: Calculate the inflation rate to two decimal points of precision. following graph, use the green line (triangle symbol) to plot the long-run aggregate supply (LRAS) curve for this economy. LRAS AS AD2027 AD ADE 2 14 OUTPUT (Trillions of dollars) Outcome C ists forecast that if the government takes no action and the economy continues to grow at the current rate, aggregate demand in 2028 will b the curve labeled ADA, resulting in the outcome given by point A. If, however, the government pursues an expansionary policy, aggregate I in 2028 will be given by the curve labeled AD, resulting in the outcome given by point B. owing table presents projections for the unemployment rates that would occur at point A and point B. Consider the potential rate of inflation 12027 and 2029, depending on whether the economy moves from the initial price level of 102 to the price level at outcome A or the price le ime B. At the natural level of output At the natural rate of unemployment Representing the tradeoff between unemployment and inflation Unemployment Rate Inflation Rate 1% 5% d on your answers to the preceding parts, use the black line (plus symbol) to draw the short-run Phillips curve (SRPC) for this economy in 2028 e: You will not be graded on any changes you make to this graph.) INFLATION RATE (Percent 7 0 0 1 2 3 4 8 7 8 UNEMPLOYMENT RATE (Percent) SRPC A LRPC Now consider the long-run effects of this policy. Suppose, in particular, that following implementation of the policy, the aggregate demand curve remains at ADB. The long-run equilibrium that would follow such a policy is designated outcome C. Going back to the first graph, place the grey point (star symbol) at outcome C. Because output at point C is the natural level of output, the unemployment rate associated with outcome C is the natural rate of unemployment. Finally, use the green line (triangle symbol) to draw the long-run Phillips curve (LRPC) on the second graph. This line is line: Representing the tradeoff between unemployment and inflation At the natural rate of unemployment

Principles of Economics 2e
2nd Edition
ISBN:9781947172364
Author:Steven A. Greenlaw; David Shapiro
Publisher:Steven A. Greenlaw; David Shapiro
Chapter24: The Aggregate Demand/aggregate Supply Model
Section: Chapter Questions
Problem 60CTQ: The imaginary country of Harris Island has the aggregate supply and aggregate demand curves as Table...

Related questions
Question
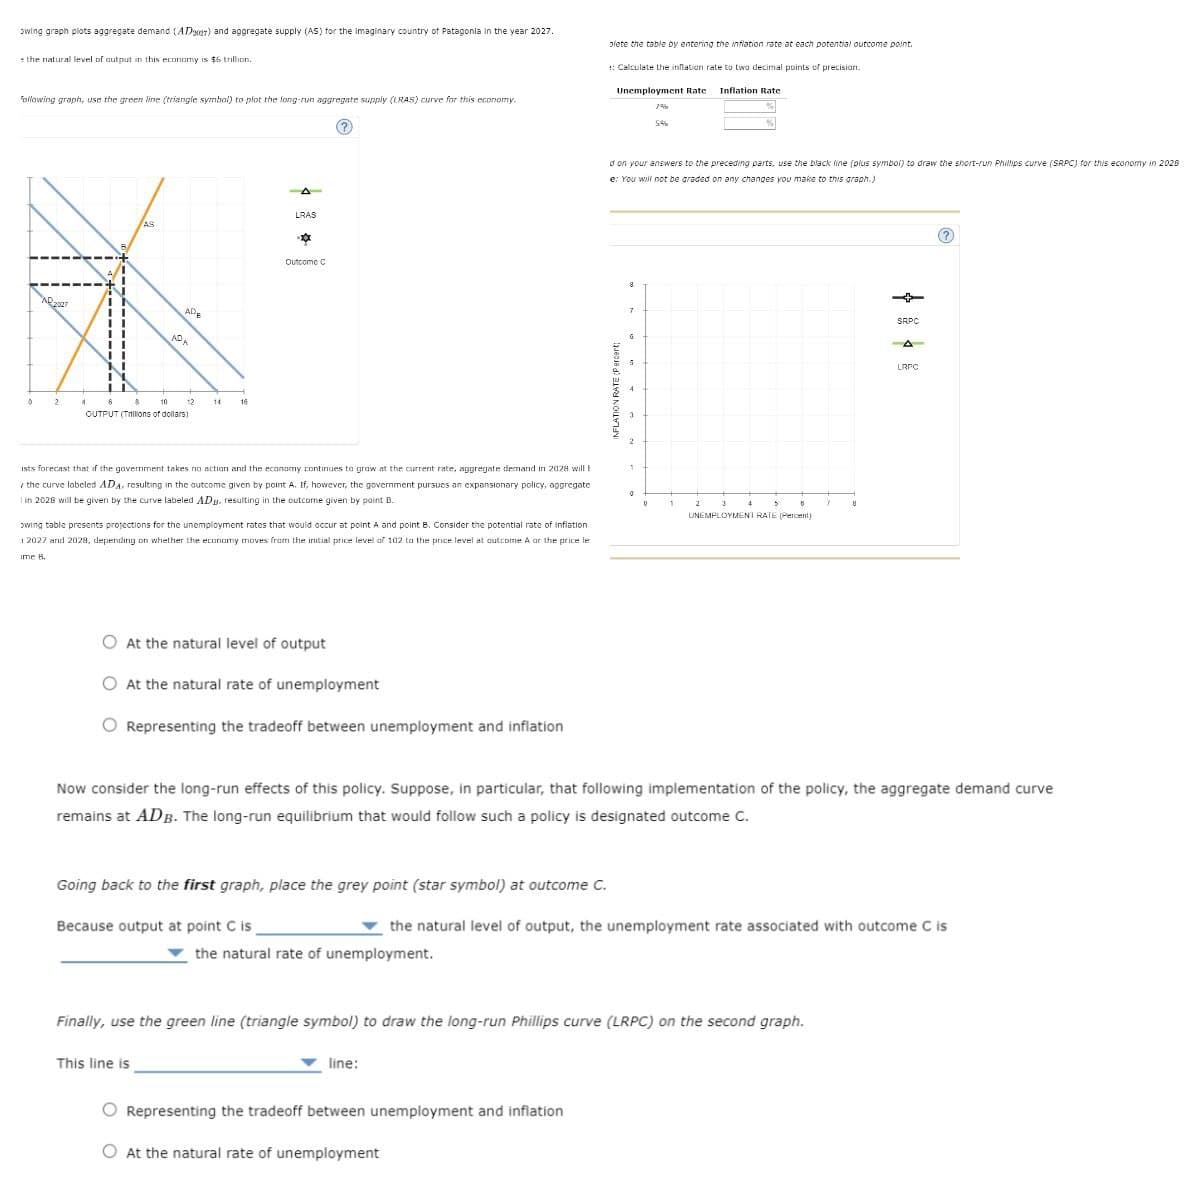
Transcribed Image Text:owing graph plots aggregate demand (ADyer) and aggregate supply (AS) for the imaginary country of Patagonia in the year 2027.
the natural level of output in this economy is $6 trillion.
plete the table by entering the inflation rate at each potential outcome point.
:: Calculate the inflation rate to two decimal points of precision.
following graph, use the green line (triangle symbol) to plot the long-run aggregate supply (LRAS) curve for this economy.
LRAS
AS
AD2027
AD
ADE
2
14
OUTPUT (Trillions of dollars)
Outcome C
ists forecast that if the government takes no action and the economy continues to grow at the current rate, aggregate demand in 2028 will b
the curve labeled ADA, resulting in the outcome given by point A. If, however, the government pursues an expansionary policy, aggregate
I in 2028 will be given by the curve labeled AD, resulting in the outcome given by point B.
owing table presents projections for the unemployment rates that would occur at point A and point B. Consider the potential rate of inflation
12027 and 2029, depending on whether the economy moves from the initial price level of 102 to the price level at outcome A or the price le
ime B.
At the natural level of output
At the natural rate of unemployment
Representing the tradeoff between unemployment and inflation
Unemployment Rate
Inflation Rate
1%
5%
d on your answers to the preceding parts, use the black line (plus symbol) to draw the short-run Phillips curve (SRPC) for this economy in 2028
e: You will not be graded on any changes you make to this graph.)
INFLATION RATE (Percent
7
0
0
1
2
3
4
8
7
8
UNEMPLOYMENT RATE (Percent)
SRPC
A
LRPC
Now consider the long-run effects of this policy. Suppose, in particular, that following implementation of the policy, the aggregate demand curve
remains at ADB. The long-run equilibrium that would follow such a policy is designated outcome C.
Going back to the first graph, place the grey point (star symbol) at outcome C.
Because output at point C is
the natural level of output, the unemployment rate associated with outcome C is
the natural rate of unemployment.
Finally, use the green line (triangle symbol) to draw the long-run Phillips curve (LRPC) on the second graph.
This line is
line:
Representing the tradeoff between unemployment and inflation
At the natural rate of unemployment
Expert Solution
This question has been solved!
Explore an expertly crafted, step-by-step solution for a thorough understanding of key concepts.

Step by step
Solved in 2 steps

Recommended textbooks for you
Principles of Economics 2e
Economics
ISBN:
9781947172364
Author:
Steven A. Greenlaw; David Shapiro
Publisher:
OpenStax


Principles of Economics 2e
Economics
ISBN:
9781947172364
Author:
Steven A. Greenlaw; David Shapiro
Publisher:
OpenStax


Exploring Economics
Economics
ISBN:
9781544336329
Author:
Robert L. Sexton
Publisher:
SAGE Publications, Inc
