P 2303: FINANCIAL ANALYSIS AND REPORTING SY 2021-2022 (FINAL OUTPUT) ABC INDUSTRIES CONSOLIDATED INCOME STATEMENT DECEMBER 31, 2020 2020 2019 Amount Percent Amount Percent Net Sales P 38,028,500 P 26,315,420 Cost of Goods Sold 26,358,500 16,526,084 Gross Profit P 11,670,000 9,789,336 Selling Expenses General and Administrative Expenses 2,123,420 Total Operating Expenses Earnings before income tax 7,111,740 6,157,808 1,368,402 9,235,160 2,434,840 7,526,210 2,263,126 Income tax 925,239 868,409 Net Income P 1,509,601 1,394,717 Common Stock shares Outstanding 2,500,000 2,498,750 Earnings per share Of common stock 0.60 0.56
P 2303: FINANCIAL ANALYSIS AND REPORTING SY 2021-2022 (FINAL OUTPUT) ABC INDUSTRIES CONSOLIDATED INCOME STATEMENT DECEMBER 31, 2020 2020 2019 Amount Percent Amount Percent Net Sales P 38,028,500 P 26,315,420 Cost of Goods Sold 26,358,500 16,526,084 Gross Profit P 11,670,000 9,789,336 Selling Expenses General and Administrative Expenses 2,123,420 Total Operating Expenses Earnings before income tax 7,111,740 6,157,808 1,368,402 9,235,160 2,434,840 7,526,210 2,263,126 Income tax 925,239 868,409 Net Income P 1,509,601 1,394,717 Common Stock shares Outstanding 2,500,000 2,498,750 Earnings per share Of common stock 0.60 0.56

Survey of Accounting (Accounting I)
8th Edition
ISBN:9781305961883
Author:Carl Warren
Publisher:Carl Warren
Chapter9: Metric-analysis Of Financial Statements
Section: Chapter Questions
Problem 9.4.10P: Twenty metrics of liquidity, solvency, and profitability The comparative financial statements of...

Related questions
Question
1. Prepare Vertical Analysis for both the income statement and the balance sheet.
2. Examine the company's Assets, Liabilities and
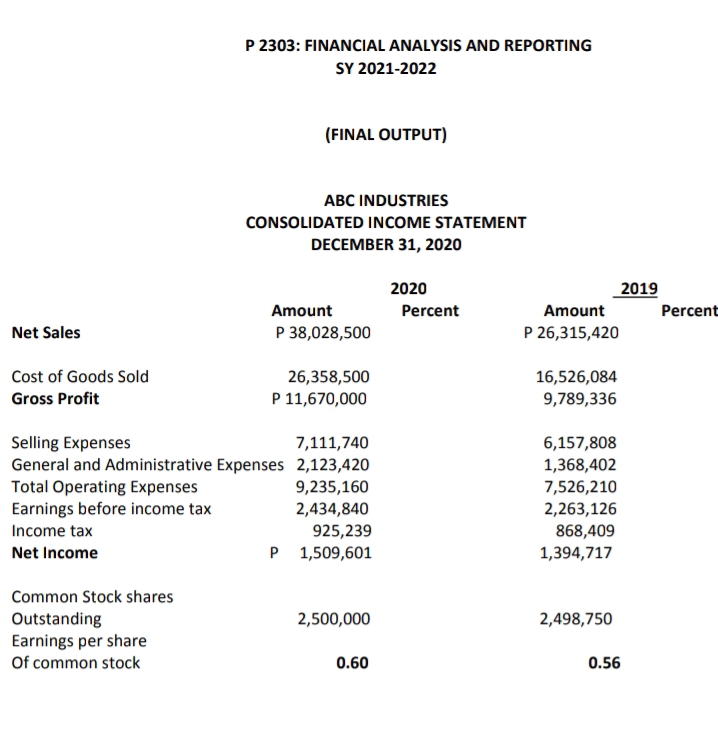
Transcribed Image Text:P 2303: FINANCIAL ANALYSIS AND REPORTING
SY 2021-2022
(FINAL OUTPUT)
ABC INDUSTRIES
CONSOLIDATED INCOME STATEMENT
DECEMBER 31, 2020
2020
2019
Amount
Percent
Amount
Percent
Net Sales
P 38,028,500
P 26,315,420
16,526,084
9,789,336
Cost of Goods Sold
26,358,500
Gross Profit
P 11,670,000
Selling Expenses
7,111,740
General and Administrative Expenses 2,123,420
9,235,160
2,434,840
925,239
P 1,509,601
6,157,808
1,368,402
7,526,210
2,263,126
868,409
1,394,717
Total Operating Expenses
Earnings before income tax
Income tax
Net Income
Common Stock shares
Outstanding
Earnings per share
Of common stock
2,500,000
2,498,750
0.60
0.56
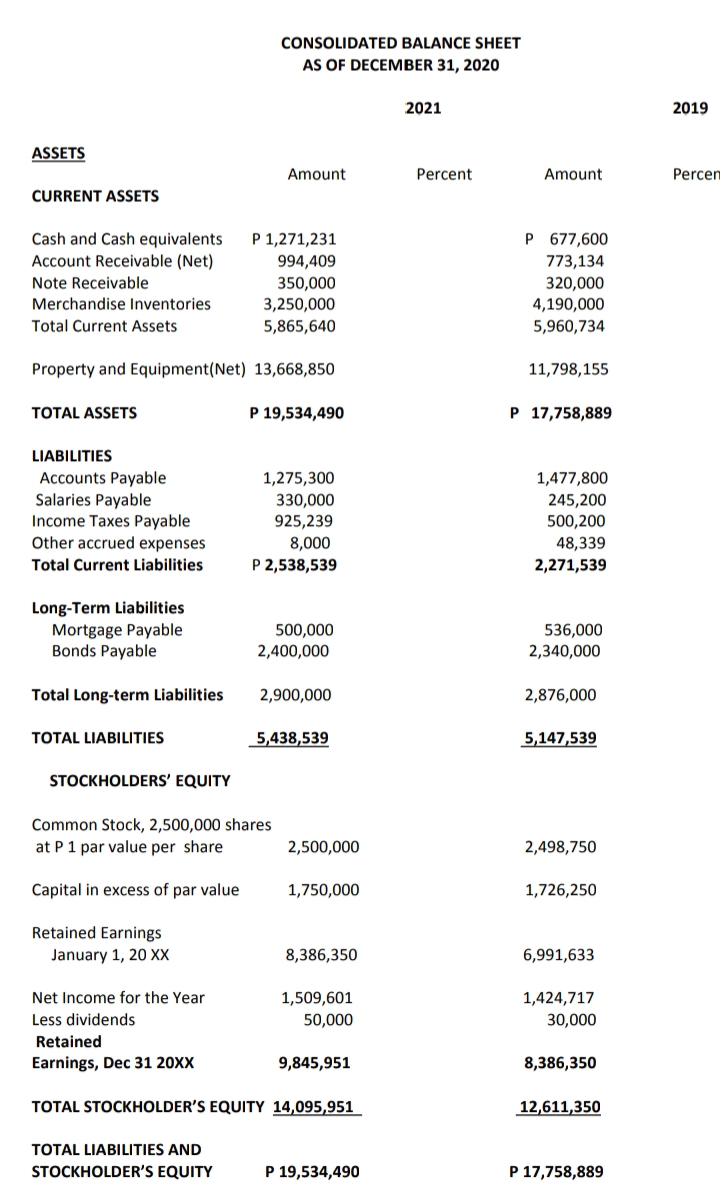
Transcribed Image Text:CONSOLIDATED BALANCE SHEET
AS OF DECEMBER 31, 2020
2021
2019
ASSETS
Amount
Percent
Amount
Percen
CURRENT ASSETS
Cash and Cash equivalents
P 1,271,231
P 677,600
Account Receivable (Net)
994,409
773,134
Note Receivable
350,000
3,250,000
320,000
4,190,000
Merchandise Inventories
Total Current Assets
5,865,640
5,960,734
Property and Equipment(Net) 13,668,850
11,798,155
TOTAL ASSETS
P 19,534,490
P 17,758,889
LIABILITIES
Accounts Payable
Salaries Payable
Income Taxes Payable
Other accrued expenses
1,275,300
1,477,800
330,000
245,200
500,200
48,339
925,239
8,000
Total Current Liabilities
P 2,538,539
2,271,539
Long-Term Liabilities
Mortgage Payable
Bonds Payable
500,000
536,000
2,340,000
2,400,000
Total Long-term Liabilities
2,900,000
2,876,000
TOTAL LIABILITIES
5,438,539
5,147,539
STOCKHOLDERS' EQUITY
Common Stock, 2,500,000 shares
at P1 par value per share
2,500,000
2,498,750
Capital in excess of par value
1,750,000
1,726,250
Retained Earnings
January 1, 20 XX
8,386,350
6,991,633
Net Income for the Year
1,509,601
1,424,717
Less dividends
50,000
30,000
Retained
Earnings, Dec 31 20XX
9,845,951
8,386,350
TOTAL STOCKHOLDER'S EQUITY 14,095,951
12,611,350
TOTAL LIABILITIES AND
STOCKHOLDER'S EQUITY
P 19,534,490
P 17,758,889
Expert Solution
This question has been solved!
Explore an expertly crafted, step-by-step solution for a thorough understanding of key concepts.

This is a popular solution!

Trending now
This is a popular solution!

Step by step
Solved in 3 steps with 2 images

Knowledge Booster


Learn more about
Need a deep-dive on the concept behind this application? Look no further. Learn more about this topic, accounting and related others by exploring similar questions and additional content below.Recommended textbooks for you
Survey of Accounting (Accounting I)
Accounting
ISBN:
9781305961883
Author:
Carl Warren
Publisher:
Cengage Learning
Survey of Accounting (Accounting I)
Accounting
ISBN:
9781305961883
Author:
Carl Warren
Publisher:
Cengage Learning