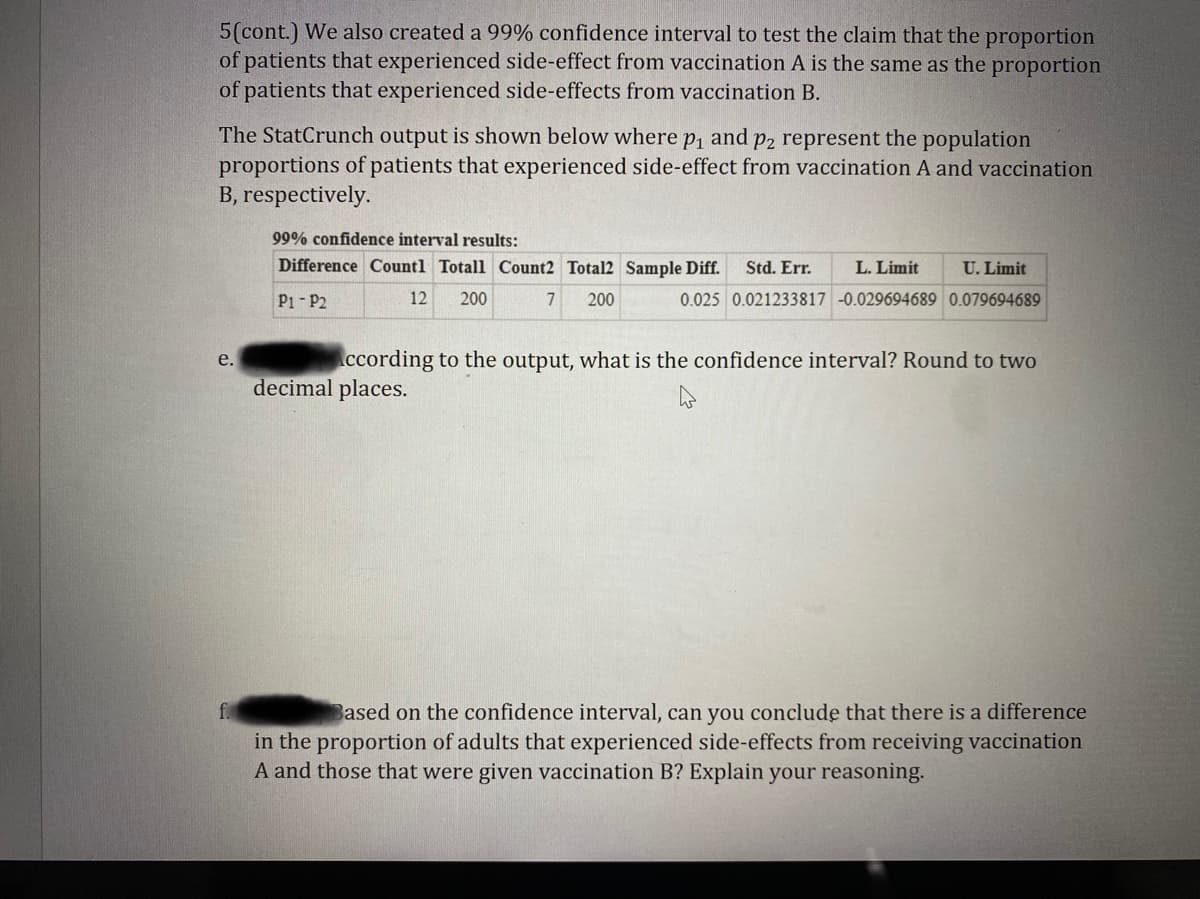
P1-P2 12 200 200 0.025 0.021233817 -0.029694689 0.079694689 According to the output, what is the confidence interval? Round to two e. decimal places. Based on the confidence interval, can you conclude that there is a difference in the proportion of adults that experienced side-effects from receiving vaccination A and those that were given vaccination B? Explain your reasoning.

MATLAB: An Introduction with Applications
6th Edition
ISBN:9781119256830
Author:Amos Gilat
Publisher:Amos Gilat
Chapter1: Starting With Matlab
Section: Chapter Questions
Problem 1P
icon
Related questions
icon
Concept explainers
Topic Video
Question
Help
5(cont.) We also created a 99% confidence interval to test the claim that the proportion
of patients that experienced side-effect from vaccination A is the same as the proportion
of patients that experienced side-effects from vaccination B.
The StatCrunch output is shown below where p1 and p2 represent the population
proportions of patients that experienced side-effect from vaccination A and vaccination
B, respectively.
99% confidence interval results:
Difference Countl Totall Count2 Total2 Sample Diff.
Std. Err.
L. Limit
U. Limit
P1- P2
12
200
7
200
0.025 0.021233817 -0.029694689 0.079694689
According to the output, what is the confidence interval? Round to two
е.
decimal places.
Based on the confidence interval, can you conclude that there is a difference
in the proportion of adults that experienced side-effects from receiving vaccination
A and those that were given vaccination B? Explain your reasoning.
Transcribed Image Text:5(cont.) We also created a 99% confidence interval to test the claim that the proportion of patients that experienced side-effect from vaccination A is the same as the proportion of patients that experienced side-effects from vaccination B. The StatCrunch output is shown below where p1 and p2 represent the population proportions of patients that experienced side-effect from vaccination A and vaccination B, respectively. 99% confidence interval results: Difference Countl Totall Count2 Total2 Sample Diff. Std. Err. L. Limit U. Limit P1- P2 12 200 7 200 0.025 0.021233817 -0.029694689 0.079694689 According to the output, what is the confidence interval? Round to two е. decimal places. Based on the confidence interval, can you conclude that there is a difference in the proportion of adults that experienced side-effects from receiving vaccination A and those that were given vaccination B? Explain your reasoning.
5. Suppose that two types of vaccines are being tested to determine if there is a
difference in the proportion of adults that experienced side-effects after its
administration. In a random sample of 200 participants that were given vaccination
A, 12 showed side-effects. In a random sample of 200 participants that were given
vaccination B, 7 showed side-effects. Use a hypothesis test to test the claim that the
proportion of patients that experienced side-effect from vaccination A is the same as
the proportion of patients that experienced side-effects from vaccination B.
Let p, and p2 represent the population proportions of patients that experienced
side-effect from vaccination A and vaccination B, respectively.
Transcribed Image Text:5. Suppose that two types of vaccines are being tested to determine if there is a difference in the proportion of adults that experienced side-effects after its administration. In a random sample of 200 participants that were given vaccination A, 12 showed side-effects. In a random sample of 200 participants that were given vaccination B, 7 showed side-effects. Use a hypothesis test to test the claim that the proportion of patients that experienced side-effect from vaccination A is the same as the proportion of patients that experienced side-effects from vaccination B. Let p, and p2 represent the population proportions of patients that experienced side-effect from vaccination A and vaccination B, respectively.
Expert Solution
steps

Step by step

Solved in 2 steps

Blurred answer
Knowledge Booster
Application of Algebra
Learn more about
Need a deep-dive on the concept behind this application? Look no further. Learn more about this topic, statistics and related others by exploring similar questions and additional content below.
Similar questions
  • SEE MORE QUESTIONS
Recommended textbooks for you
MATLAB: An Introduction with Applications
Statistics
ISBN:
9781119256830
Author:
Amos Gilat
Publisher:
John Wiley & Sons Inc
Probability and Statistics for Engineering and th…
Statistics
ISBN:
9781305251809
Author:
Jay L. Devore
Publisher:
Cengage Learning
Statistics for The Behavioral Sciences (MindTap C…
Statistics
ISBN:
9781305504912
Author:
Frederick J Gravetter, Larry B. Wallnau
Publisher:
Cengage Learning
Elementary Statistics: Picturing the World (7th E…
Statistics
ISBN:
9780134683416
Author:
Ron Larson, Betsy Farber
Publisher:
PEARSON
The Basic Practice of Statistics
Statistics
ISBN:
9781319042578
Author:
David S. Moore, William I. Notz, Michael A. Fligner
Publisher:
W. H. Freeman
Introduction to the Practice of Statistics
Statistics
ISBN:
9781319013387
Author:
David S. Moore, George P. McCabe, Bruce A. Craig
Publisher:
W. H. Freeman