Region Y, 48th week 2010 to 27th week 2011 Weeks Cases Deaths 48th 6 3 49th 254 85 7th 8th gth 10th 11th 20 16 23 25 57 2 3 1 1 4
Region Y, 48th week 2010 to 27th week 2011 Weeks Cases Deaths 48th 6 3 49th 254 85 7th 8th gth 10th 11th 20 16 23 25 57 2 3 1 1 4

Mathematics For Machine Technology
8th Edition
ISBN:9781337798310
Author:Peterson, John.
Publisher:Peterson, John.
Chapter29: Tolerance, Clearance, And Interference
Section: Chapter Questions
Problem 20A: Mating parts are shown in Figure 29-16. The pins in the top piece fit into the holes in the bottom...

Related questions
Question
Generate a graph and interpret the results
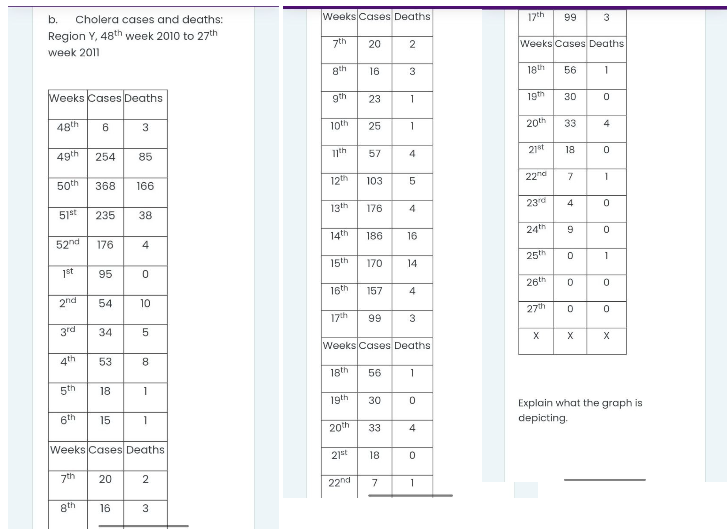
Transcribed Image Text:b. Cholera cases and deaths:
Region Y, 48th week 2010 to 27th
week 2011
Weeks Cases Deaths
48th
6
3
49th
254
85
50th 368 166
51st
235 38
52nd
176
4
1st
95
0
2nd
54
10
3rd
34
5
4th
53
8
5th
18
1
6th
15
1
Weeks Cases Deaths
7th
20
2
8th
16
3
Weeks Cases Deaths
7th
20
2
8th
16
3
gth
23
1
10th
25
1
11th
57
4
12th
103
5
13th
176
186
16
170
14
157
4
17th
99
3
Weeks Cases Deaths
18th
56
1
19th
30
20th
33
21st
18
22nd
7
14th
15th
16th
-
0
4
0
1
17th
99
3
Weeks Cases Deaths
18th
56
1
30
0
33
4
18
0
7
1
4
0
9
0
0
1
26th
0
0
27th
0
0
X
X
Explain what the graph is
depicting.
19th
20th
21st
22nd
23rd
24th
25th
Expert Solution
This question has been solved!
Explore an expertly crafted, step-by-step solution for a thorough understanding of key concepts.

Step by step
Solved in 3 steps with 3 images

Recommended textbooks for you
Mathematics For Machine Technology
Advanced Math
ISBN:
9781337798310
Author:
Peterson, John.
Publisher:
Cengage Learning,
Mathematics For Machine Technology
Advanced Math
ISBN:
9781337798310
Author:
Peterson, John.
Publisher:
Cengage Learning,