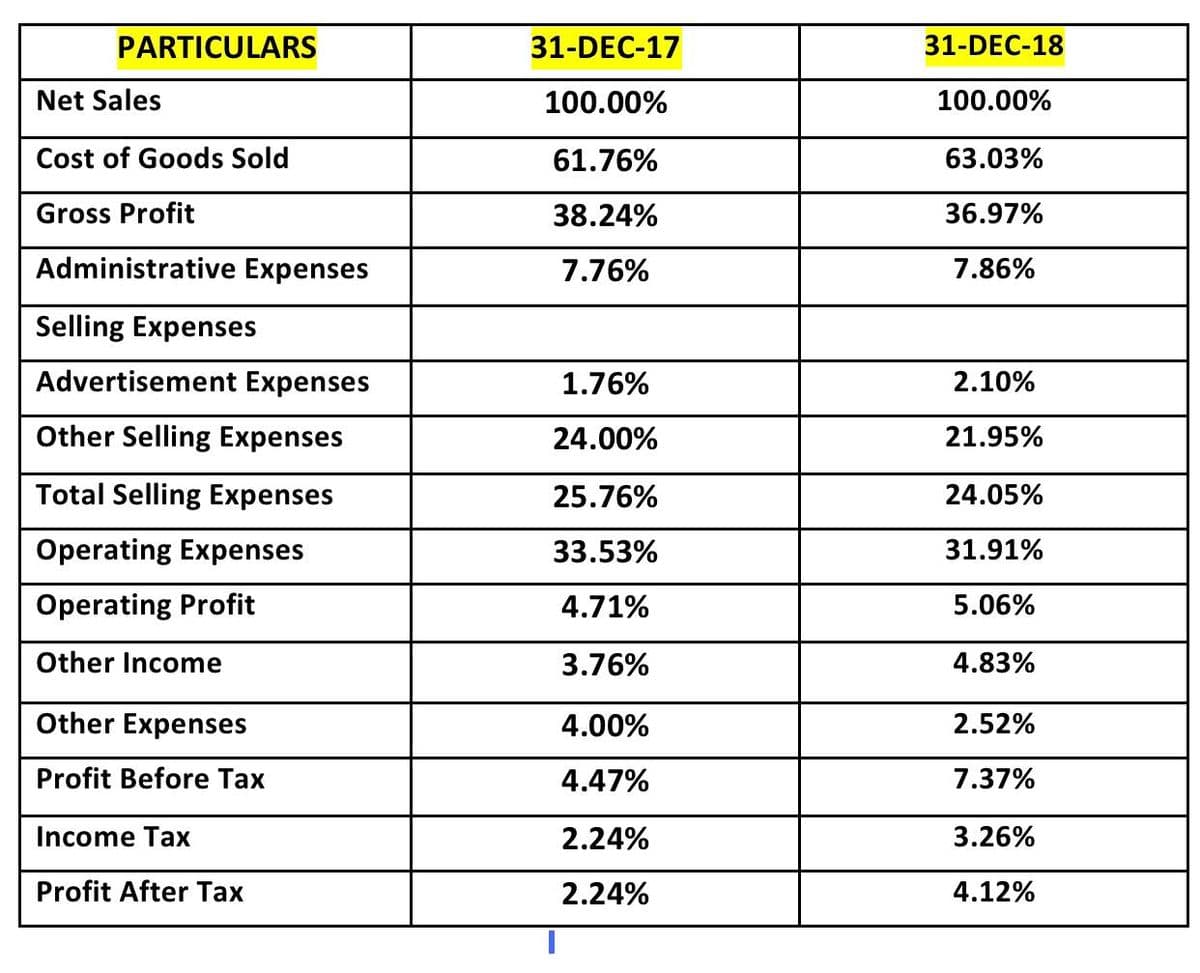
Interpret the data comparing it to the data in December 2017, which year the company perform better Create a pie graph for December 2018, using the data from vertical analysis


Q: /hen an accountant calculates different parts of a financial statement in terr fa percentage of the…
A: Solution: Vertical analysis is a method of analyzing the financial statements of a company. Under…
Q: For the months November, December, and January, I have been tasked to find the Current Liabilites,…
A: Five important components of financial statements Revenue, Expenses, Assets, Liabilities and Equity.…
Q: Management accounting: a. focuses on estimating future revenues, costs, and other measures to…
A: The financial position of the company can be arrived from the income statement prepared by the…
Q: 1. Compute the given in your module dated December 2018 using vertical analysis 2. Interpret the…
A: Income statement shows the profit earned or loss incurred during the period.
Q: What type of analytics would encompass creating Key Performance Indicators (KPI’s) from the…
A: Introduction: Customers are driven by key performance indicators (KPIs), which are used by…
Q: The life of a business is divided into specific time periods,usually a year, to measure results of…
A: (a)If a business is run without any accounting period, the decision makers of the business will have…
Q: Tata Unisys is an integrated IT sector company. Its products include mini and microprocessor-based…
A: Liquidity Ratios: These ratios represent the short-term liquidity position of the company Current…
Q: your line manager wants to assess your understanding and ability to prepare and produce the…
A: Trial balance as of December 31 and adjustment entries are given Therefore, before preparation of…
Q: Compare the performance of both companies with each other, for each of the calculated indicators and…
A: here Merck and j&j are two companies that we are comparing each other whose performance is…
Q: 1. Describe the trend of revenues from 2007 to 2010. What observations can be drawn? 2. Describe the…
A: Description of the trends is provided below:
Q: The company has decided to put all its financial reports on its website to increase .......... with…
A: The correct answer is Option (A) Transparency.
Q: . Describe the trend of revenues from 2007 to 2010. What observations can be drawn? 2. Describe the…
A: The question is related to Analysis of Imcome Statement from year 2007 to 2010.
Q: Required: (a) Calculate for both years two ratios that relate to gearing. Show your workings. (b)…
A: Gearing ratios are kind of financial ratios that measure the performance of a business entity based…
Q: Questions: 1. Make a comparison for each company based on computed ratio. 2. What is your…
A: The performance of the two companies can be evaluated using the ratio. The ratio provides a view of…
Q: USA Airlines uses the following performance measures. Classify the performance measures belowinto…
A: Balanced scorecard: It is a strategic planning of the company in order to reach its targets. It is a…
Q: USA Airlines uses the following performance measures. Classify the performance measures belowinto…
A: Balance scorecard: A balanced scorecard is a tool of strategic planning and management, which is…
Q: Solve using weighted average. Show the solution in good accounting form
A: Equivalent units of products concept came in to existence when some units are not fully completed at…
Q: Make an economic statement of your own which has impact as follows in “a” and then journalize that…
A: Economic Statement for • Increase one asset, decrease another asset, and increase a liability.. On…
Q: USA Airlines uses the following performance measures. Classify the performance measures belowinto…
A: Balanced scorecard: It is a tool to measure the performance that relates a company’s strategy to…
Q: Management accounting is considered most likely to be successful when it: A) B) C) is timely D) a.…
A: Management accounting is that branch of accounting which helps management in making decisions with…
Q: Conduct the common size analysis by taking into consideration income statement of 4 companies.…
A: A typical size fiscal summary showcases details as a level of one chose or basic figure. Making…
Q: When employees choose a company through financial statements, which parts ,point and ratio should…
A: Financial statement: Financial statements are organized summaries of detailed information about the…
Q: Perform a vertical analysis on both companies. Comment on at least three points, interpreting the…
A: Vertical Analysis of Financial statements is a method which discloses the relationship between items…
Q: Create a table shown below. From the Performance task activity Activity 4), use the 10 business…
A: The accounting equation states that the total of assets is equal to the sum total of liabilities and…
Q: Advertising Materials drew up the following trial balance for the year ending 31 December 2010 Draw…
A: solution concept statement of comprehensive income (income statement) is prepared to present the…
Q: This discussion is derived from the "Analysis for Decision Making" ADM Section at the end of Chapter…
A: Financial Statements shows the financial position of a firm on a specified date. The users of…
Q: Please prepare. Income Statement (Multi-step) and Financial Position thank yooouu!
A: Multi step income statement is one of the financial statement which is prepared for analysing…
Q: an Income Statement for the current year using "functional presentation" with supporting notes. Used…
A: Income Statement with functional presentation is basically presentation which involves…
Q: USA Airlines uses the following performance measures. Classify the performance measures belowinto…
A: Balanced scorecard: It is a tool to measure the performance that relates a company’s strategy to…
Q: Indicate whether each decision is most likely to be made using managerial accounting information or…
A: Managerial accounting is that the observe of distinctive, measuring, analyzing, decoding, and act…
Q: Time to settle a claim from a customer is an example of which performance measure? Reporting…
A: Strategic management is the process of establishing goals, procedures, and objectives in order to…
Q: USA Airlines uses the following performance measures. Classify the performance measures belowinto…
A: Balanced scorecard: It is a tool to measure the performance that relates a company’s strategy to…
Q: 4. An analysis of the intenelationships of infommation in a single period, expressed as parcentages…
A: Horizontal analysis means where the analysis is made with regard with two different period where as…
Q: Susan is looking for a method of how she could calculate and interpret the financial ratio so as to…
A: Benchmarking: Under this method, some benchmarks are set and the actual results are evaluated by…
Q: Interpret the results of the ratios and explain what does that mean to the performance of the…
A: Following ratios are used to find out the financial performance of the organization as at 31…
Q: USA Airlines uses the following performance measures. Classify the performance measures belowinto…
A: Balanced scorecard: It is a tool to measure the performance that relates a company’s strategy to…
Q: . Describe the trend of revenues from 2007 to 2010. What observations can be drawn? 2. Describe the…
A: The trends are provided below:
Q: The matching principle states that ________. A. financial statements can be prepared for…
A: Matching Concept : Matching principle informs a company to record expenses incurred on its income…
Q: a) Calculate each of the missing values. b) Comment on each company's performance in relation to the…
A: Ratio analysis refers to an overview of the company’s performance by calculation various ratio using…
Q: Describe the trend of revenues from 2007 to 2010. What observations can be drawn? 2. Describe the…
A: Trend of the components of income statement can be drawn and analyzed further over a period of time,…
- Interpret the data comparing it to the data in December 2017, which year the company perform better
- Create a pie graph for December 2018, using the data from vertical analysis.

Step by step
Solved in 2 steps with 1 images

- 58 Charleston, Inc. had the following information: Year 2 Year 1 Net Sales 210,000 194,800 Cost of goods sold 128,000 140,600 Operating Expenses 34,400 23,000 Net Income 47,600 31,200 Using vertical analysis for Year 1, what is the percentage of cost of goods sold and operating expenses, respectively? Group of answer choices 11.8% and 27.8% 72.2% and 16.0% 16.0% and 11.8% 61.0% and 22.7% 61.0% and 16.4% 16.4% and 39.0% 72.2% and 11.8%Sales revenue $39,900 $75,300 $573,800 $35,400 $55,100Cost of goods sold 19,000 49,500 265,900 19,300 30,200Operating expenses 10,100 40,500 233,700 11,900 18,300 Total expenses 29,100 90,000 499,600 31,200 48,500Operating profit (loss) $10,800 $(14,700) $74,200 $4,200 $6,600Identifiable assets $35,200 $79,900 $493,400 $66,300 $49,900 Prepare the necessary disclosures required by GAAPABC Company Income Statement Period Ending 31-Dec-15 31-Dec-14 31-Dec-13 Total Sales $485,651,000 $476,294,000 $475,210,000 Cost of Goods Sold 365,086,000 358,069,000 350,400,000 Gross Profit 120,565,000 118,225,000 124,810,000 Selling Generall and Adminstrative 93,418,000 91,353,000 90,343,000 Operating Profit 27,147,000 26,872,000 34,467,000 Total Other Income/Expenses Net 113,000 119,000 115,000 Earnings before Interest and Taxes 27,034,000 26,753,000 34,352,000 Interest Expense 2,461,000 2,335,000 2,200,000 Income Before Tax 24,573,000 24,418,000 32,152,000 Income Tax Expense 7,985,000 8,105,000 9,800,000 Net Income from Continuing Ops 16,588,000…
- ABC Company Income Statement Period Ending 31-Dec-15 31-Dec-14 31-Dec-13 Total Sales $485,651,000 $476,294,000 $475,210,000 Cost of Goods Sold 365,086,000 358,069,000 350,400,000 Gross Profit 120,565,000 118,225,000 124,810,000 Selling Generall and Adminstrative 93,418,000 91,353,000 90,343,000 Operating Profit 27,147,000 26,872,000 34,467,000 Total Other Income/Expenses Net 113,000 119,000 115,000 Earnings before Interest and Taxes 27,034,000 26,753,000 34,352,000 Interest Expense 2,461,000 2,335,000 2,200,000 Income Before Tax 24,573,000 24,418,000 32,152,000 Income Tax Expense 7,985,000 8,105,000 9,800,000 Net Income from Continuing Ops 16,588,000…ABC Company Income Statement Period Ending 31-Dec-15 31-Dec-14 31-Dec-13 Total Sales $485,651,000 $476,294,000 $475,210,000 Cost of Goods Sold 365,086,000 358,069,000 350,400,000 Gross Profit 120,565,000 118,225,000 124,810,000 Selling Generall and Adminstrative 93,418,000 91,353,000 90,343,000 Operating Profit 27,147,000 26,872,000 34,467,000 Total Other Income/Expenses Net 113,000 119,000 115,000 Earnings before Interest and Taxes 27,034,000 26,753,000 34,352,000 Interest Expense 2,461,000 2,335,000 2,200,000 Income Before Tax 24,573,000 24,418,000 32,152,000 Income Tax Expense 7,985,000 8,105,000 9,800,000 Net Income from Continuing Ops 16,588,000…ABC Company Income Statement Period Ending 31-Dec-15 31-Dec-14 31-Dec-13 Total Sales $485,651,000 $476,294,000 $475,210,000 Cost of Goods Sold 365,086,000 358,069,000 350,400,000 Gross Profit 120,565,000 118,225,000 124,810,000 Selling Generall and Adminstrative 93,418,000 91,353,000 90,343,000 Operating Profit 27,147,000 26,872,000 34,467,000 Total Other Income/Expenses Net 113,000 119,000 115,000 Earnings before Interest and Taxes 27,034,000 26,753,000 34,352,000 Interest Expense 2,461,000 2,335,000 2,200,000 Income Before Tax 24,573,000 24,418,000 32,152,000 Income Tax Expense 7,985,000 8,105,000 9,800,000 Net Income from Continuing Ops 16,588,000…
- March1 Beginning Inventory 60 units @ $15 per unit 5 Purchase 140 units @ $15.5 per unit 14 Sales 190 units @ $19 per unit 27 Purchase 70 units @ $16 per unit 29 Sales 30 units @ 19.50 per unit find the weighted average cost of good sale $1120 $4190 $3220 $3414Exercise 1-6 Traditional and Contribution Format Income Statements [LO1-6] Cherokee Inc. is a merchandiser that provided the following information: Number of units sold 13,000 Selling price per unit $ 17 Variable selling expense per unit $ 2 Variable administrative expense per unit $ 2 Total fixed selling expense $ 20,000 Total fixed administrative expense $ 14,000 Beginning merchandise inventory $ 8,000 Ending merchandise inventory $ 22,000 Merchandise purchases $ 88,000 Required: 1. Prepare a traditional income statement. Cherokee, Inc. Traditional Income Statement Sales $221,000 Cost of goods sold 74,000 Gross margin 147,000 Selling and administrative expenses: Administrative expenses 40,000 Selling expenses 46,000 86,000 Net operating income $61,000 + 2. Prepare a contribution format income statement.…Year 1 Year 2 Year 3 Year 4 $ % $ % $ % $ % Net Sales $ 500,000.00 100.00% $ 540,000.00 100.00% $ 577,800.00 100.00% $ 612,468.00 100.00% Cost of goods 265,000.00 53.00% $ 283,500.00 52.50% $ 300,456.00 52.00% $ 321,545.70 52.50% Gross Margin 235,000.00 47.00% $ 256,500.00 47.50% $ 277,344.00 48.00% $ 290,922.30 47.50% Operating expenses 210,000.00 42.00% $ 226,800.00 42.00% $ 245,565.00 42.50% $ 257,236.56 42.00% Operating proft 25,000.00 5.00% $ 29,700.00 5.50% $ 31,779.00 5.50% $ 33,685.74 5.50% Supposing that Mr. Ptolemy achieved his Year 3 and Year 4 performance goals as planned, compare the Year 1 through Year 4 yearly results. Hint: Calculate ‘ trends’ from Year 1 to Year 2, from Year 2 to Year 3, and from Year 3 to Year 4 in terms of NS, COGS, GM,OE and profit. Show your calculations and interpret the meaning of the obtained trend figures. Year 1-2…
- 1. Year one income statement by months ( sales by year 3 $2.7m 2.7 m /3 = $900,000 average each year sales 900,000 / 12 = $75,000 sales each month Revenues: Net sales $75,000 each month Expenses and loses Costs of goods sold 1,786 x $15.60 = $27,863.78 Capital expenses $1,150 / 12= $95.83 Location expenses $76,415/ 12 = $6,367.92 Advertising / Promotional expenses $78,285/ 12 = $6,523.75 CalculateTotal expenses Depreciation expense is straight line for this project ?. Use the market value of the asset divided by monthly expected life of the asset, We will not use salvage value in calculating depreciation expense.J Gross Sales Sales Return & Allowances Sales Discounts Cost of Merchandise Sold 33,000 O $87,000 O $46,000 100,000 Given the above values, determine Net Sales. O $67,000 10,000 O $54,000 3,000 Need help? Review these concept resources.16.. Partially correct answer icon Your answer is partially correct. The income statement of Bonita Company is shown below. BONITA COMPANYINCOME STATEMENTFOR THE YEAR ENDED DECEMBER 31, 2020 Sales revenue $6,470,000 Cost of goods sold Beginning inventory $2,050,000 Purchases 4,300,000 Goods available for sale 6,350,000 Ending inventory 1,650,000 Cost of goods sold 4,700,000 Gross profit 1,770,000 Operating expenses Selling expenses 430,000 Administrative expenses 700,000 1,130,000 Net income $640,000 Additional information: 1. Accounts receivable decreased $290,000 during the year. 2. Prepaid expenses increased $170,000 during the year. 3. Accounts payable to suppliers of merchandise decreased $280,000 during the year. 4. Accrued expenses payable decreased $130,000 during the year. 5.…