1. Describe the trend of revenues from 2007 to 2010. What observations can be drawn? 2. Describe the trend of direct costs from 2007 to 2010. What observations can be drawn? 3. Describe the trend of operating expenses from 2007 to 2010. What observations can be drawn? 4. Describe the trend of operating income from 2007 to 2010. What observations can be drawn? 5. Describe the trend of net income from 2007 to 2010. What observations can be drawn
Q: Identify which of the following six metrics a through f best completes questions 1 through 3 below.…
A: Ratio analysis:
Q: Describe the trend of operating income from 2007 to 2010. What observations can be drawn? Describe…
A: Solution:- 1)Analysis of the trend of operating income from 2007 to 2010 as follows under:- Ratio…
Q: A) Calculate the total Current Assets, Total Assets, Total Liabilities and Equity, Gross profit,…
A: A.
Q: Cost of goods sold should be matched up with the revenue generated on each year's Statement of…
A: Revenue recognition principle states that the revenue would be recognized when it is earned not when…
Q: Calculate the profit margin, return on assets, and return on equity for 2013 and 2014 for Tyler…
A: Ratio Analysis is the financial analysis tool which helps to determine liquidity, profitability and…
Q: Based on the data above, Prepare a comprehensive income statement in one report for the year ended…
A: Comprehensive income statement is similar to the normal income statement which is prepared at the…
Q: Time series analysis involves comparing a company’s income statement and balance sheet forthe…
A: Time-series studies the financial statements to compare of the current year's company performance to…
Q: The formula for determining the rate earned on total assets is Net Income + Interest Expense/Average…
A: Rate earned on total assets = (Net income + Interest expense)/Average total assets
Q: Prepare a basic income statement forecast for the subsequent fiscal year, using a percentage of…
A: Income Statement The purpose of preparing the income statement is to know the net income which are…
Q: Using the da
A: Common size income statement analyse every item of income statement as a percentage of sales. This…
Q: rom the given Statement of Financial Position and Income statement, solve for the following: 1)…
A: "Since you have posted a question with multiple sub-parts, we will solve first three sub-parts for…
Q: From the given Statement of Financial Position and Income statement, solve for the following: 1)…
A: Ratio Analysis - The ratio is the technique used by the prospective investor or an individual or…
Q: . Describe the trend of revenues from 2007 to 2010. What observations can be drawn? 2. Describe the…
A: The question is related to Analysis of Imcome Statement from year 2007 to 2010.
Q: Compute the following for year 2017 1. Gross Margin Ratio 2. Operating Profit Margin 3. Net Profit…
A: The question is related to Ratio Analysis. The ratio are calculated with the help of following…
Q: Hello, can you help me in this problem of doing the horizontal analysis. below are the data.…
A: Below are the required horizontal analysis:
Q: Which of the following is the key performance measure reported on the income statement that is…
A: Income statement is statement showing items of income and expenses
Q: If a particular listed is "other operating expenses in a condensed income statement from operations,…
A: Income from operations is very important component of Income statement which means income after…
Q: Case 1: Vertical Analysis of Profit and Loss Prepare a vertical analysis of the income statements of…
A: Answer: As per Q/A guidelines, only first 3 sub parts to be answered. Please repost remaining…
Q: During the current year, XYZ Company increased its variable SG&A expenses while keeping fixed SG&A…
A: Accounting: Accounting is a system, or a process of collecting and organizing economic…
Q: Compute the profitability and operating efficiency ratios for 2014 of Very Good Company Compute for…
A: Given, The financial statements of a company Required: To calculate the profitability ratios,…
Q: Compute the percentage change relative to the previous year in net sales for the fiscal years ending…
A: I am attempting the first three sub-parts as per company policies Income statement is a part of…
Q: What can you say about the company’s performance throughout the years? 2. What can you say about the…
A: Horizontal analysis is the analysis of the financial statements over the years periodically and…
Q: This is the operating margin from 2015 to 2019: 2015: 23.33% 2016: 15.69% 2017: 18.15% 2018: 25.06%…
A: Trend analysis is a process which is used to analyze the past movements so that the future trend can…
Q: 1. Using the financial statements above, prepare a common size income statement and balance sheet.…
A: Financial analysis is the process of assessing a company's performance in relation to its industry…
Q: d. Using the “Income Statement” worksheet, center the financial statement titles across the data…
A: Income Statement The Purpose of preparing the income statement which is provide the details of net…
Q: Comparison: 1. Observe the trend of revenues for both companies. Which company has higher revenue?…
A: solution:- Introduction:- Trend analysis shows changes in the amounts of corresponding financial…
Q: Using the Balance Sheet and the Income Statement (Statement of Revenues and Expenses) calculate…
A: Operating Margin Ratio: Operating income/Total Operating Revenue =115,000/2,000,000 = 0.0575 = 5.75%
Q: Calculate the profit margin, return on assets, and return on equity for 2013 and 2014 for Tyler…
A: Ratio Analysis is the financial analysis tool which helps to determine the company's liquidity,…
Q: When performing vertical analysis of an income statement, the base amount is ________. A sales…
A: Vertical analysis of income statement shows each item of income statement as a percentage of sales…
Q: 1. Compute the gross profit percentage in the current and previous years. Are the current-year…
A: As per Bartleby guidelines, if a question contains multiple sub parts than only first three sub…
Q: Calculate operating profit margin ratio and net profit margin ratio for the year 2015, 2016 and…
A: Here in this question, we are required to calculate the operating profit margin and net profit…
Q: If income is earned during a financial year but not yet received, which of the following will be…
A: Under accrual basis, the income and expenses are recorded when they are incurred irrespective of…
Q: On a multiple-step income statement, income from operations is arrived at after considering all…
A: Hey, since there are multiple questions posted, we will answer first question. If you want any…
Q: Q1. On a multiple-step income statement, the excess of sales over the cost of goods sold is called:…
A: A Multiple-Step Income Statement is an Income Statement which categorize income and expenses into…
Q: Based on the data in the table below... a. What is the percentage of salaries, wages, and benefits…
A: The financial ratios refer to the ratios that are calculated using the financial data from the…
Q: If Net Sales Revenue is $108,000, Gross profits are $28,000 and Operating expenses are $12,000. What…
A: ‘’Since you have asked multiple questions, we will solve the first question for you. If you want any…
Q: 1. Conduct a horizontal analysis by calculating the year-over-year changes in each line item,…
A: Solution: Introduction: Horizontal Analysis which is also known as the trend analysis. It provides a…
Q: Complete a margin analysis for Associated Industries and answer the questions below. Associated…
A: Operating Margin: The operational margin is a measure of how much profit a firm generates on a…
Q: Compute for Profitability Ratio in 2015 and 2016: 1. Gross Margin Ratio 2. Profit Margin Ratio 3.…
A: Formula: Gross Margin ratio = ( Gross profit / Net sales ) x 100
Q: . Describe the trend of revenues from 2007 to 2010. What observations can be drawn? 2. Describe the…
A: The trends are provided below:
Q: Malkiya Company gathered the following condensed data for the year ended December 31, 2020: Cost of…
A: NOTE: This set contains 2 questions and nothing has been mentioned regarding which question needs to…
Q: Presented below are the assumptions, principles, and constraint used in this chapter. 1. Economic…
A: Going concern assumption: The going concern assumption emphasizes on the longevity of the company's…
Q: Describe the trend of revenues from 2007 to 2010. What observations can be drawn? 2. Describe the…
A: Trend of the components of income statement can be drawn and analyzed further over a period of time,…
Q: If a company has $575,983 in revenues and $267,198 in total expenses, what is their percentage of…
A: Net income is considered as Excess of revenue over its expenditure during the course of business…
1. Describe the trend of revenues from 2007 to 2010. What observations can be drawn?
2. Describe the trend of direct costs from 2007 to 2010. What observations can be drawn?
3. Describe the trend of operating expenses from 2007 to 2010. What observations can be drawn?
4. Describe the trend of operating income from 2007 to 2010. What observations can be drawn?
5. Describe the trend of net income from 2007 to 2010. What observations can be drawn?
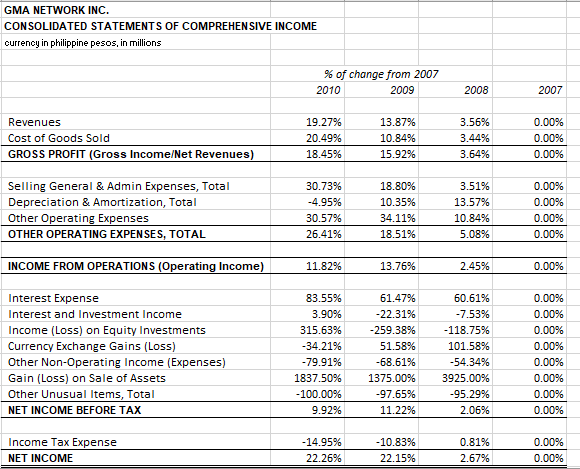
Trending now
This is a popular solution!
Step by step
Solved in 2 steps
- Income Statement for Year Ended December 31, 2018 (Millions of Dollars) Net sales 795.0 Cost of goods sold 660.0 Gross profit 135.0 Selling expenses 73.5 EBITDA 61.5 Depreciation expenses 12.0 Earnings before interest and taxes (EBIT) 49.5 Interest expenses 4.5 Earnings before taxes (EBT) 45.0 Taxes (40%) 18.0 Net income 27.0 a. Calculate the ratios you think would be useful in this analysis. b. Construct a DuPont equation, and compare the companys ratios to the industry average ratios. c. Do the balance-sheet accounts or the income statement figures seem to be primarily responsible for the low profits? d. Which specific accounts seem to be most out of line relative to other firms in the industry? e. If the firm had a pronounced seasonal sales pattern or if it grew rapidly during the year, how might that affect the validity of your ratio analysis? How might you correct for such potential problems?Marshall Inc. Comparative Income Statement For the Years Ended December 31, 20Y2 and 20Y1 1 20Y2 20Y1 2 Sales $10,850,000.00 $10,000,000.00 3 Cost of goods sold 6,000,000.00 5,450,000.00 4 Gross profit $4,850,000.00 $4,550,000.00 5 Selling expenses $2,170,000.00 $2,000,000.00 6 Administrative expenses 1,627,500.00 1,500,000.00 7 Total operating expenses $3,797,500.00 $3,500,000.00 8 Income from operations $1,052,500.00 $1,050,000.00 9 Other revenue 99,500.00 20,000.00 10 $1,152,000.00 $1,070,000.00 11 Other expense (interest) 132,000.00 120,000.00 12 Income before income tax $1,020,000.00 $950,000.00 13 Income tax expense 420,000.00 400,000.00 14 Net income $600,000.00 $550,000.00 Marshall Inc. Comparative Balance Sheet December 31, 20Y2 and 20Y1 1 20Y2 20Y1 2 Assets…Marshall Inc. Comparative Income Statement For the Years Ended December 31, 20Y2 and 20Y1 1 20Y2 20Y1 2 Sales $10,850,000.00 $10,000,000.00 3 Cost of goods sold 6,000,000.00 5,450,000.00 4 Gross profit $4,850,000.00 $4,550,000.00 5 Selling expenses $2,170,000.00 $2,000,000.00 6 Administrative expenses 1,627,500.00 1,500,000.00 7 Total operating expenses $3,797,500.00 $3,500,000.00 8 Income from operations $1,052,500.00 $1,050,000.00 9 Other revenue 99,500.00 20,000.00 10 $1,152,000.00 $1,070,000.00 11 Other expense (interest) 132,000.00 120,000.00 12 Income before income tax $1,020,000.00 $950,000.00 13 Income tax expense 420,000.00 400,000.00 14 Net income $600,000.00 $550,000.00 Marshall Inc. Comparative Balance Sheet December 31, 20Y2 and 20Y1 1 20Y2 20Y1 2 Assets…
- Marshall Inc. Comparative Income Statement For the Years Ended December 31, 20Y2 and 20Y1 1 20Y2 20Y1 2 Sales $10,850,000.00 $10,000,000.00 3 Cost of goods sold 6,000,000.00 5,450,000.00 4 Gross profit $4,850,000.00 $4,550,000.00 5 Selling expenses $2,170,000.00 $2,000,000.00 6 Administrative expenses 1,627,500.00 1,500,000.00 7 Total operating expenses $3,797,500.00 $3,500,000.00 8 Income from operations $1,052,500.00 $1,050,000.00 9 Other revenue 99,500.00 20,000.00 10 $1,152,000.00 $1,070,000.00 11 Other expense (interest) 132,000.00 120,000.00 12 Income before income tax $1,020,000.00 $950,000.00 13 Income tax expense 420,000.00 400,000.00 14 Net income $600,000.00 $550,000.00 Marshall Inc. Comparative Balance Sheet December 31, 20Y2 and 20Y1 1 20Y2 20Y1 2 Assets…Marshall Inc. Comparative Income Statement For the Years Ended December 31, 20Y2 and 20Y1 1 20Y2 20Y1 2 Sales $10,850,000.00 $10,000,000.00 3 Cost of goods sold 6,000,000.00 5,450,000.00 4 Gross profit $4,850,000.00 $4,550,000.00 5 Selling expenses $2,170,000.00 $2,000,000.00 6 Administrative expenses 1,627,500.00 1,500,000.00 7 Total operating expenses $3,797,500.00 $3,500,000.00 8 Income from operations $1,052,500.00 $1,050,000.00 9 Other revenue 99,500.00 20,000.00 10 $1,152,000.00 $1,070,000.00 11 Other expense (interest) 132,000.00 120,000.00 12 Income before income tax $1,020,000.00 $950,000.00 13 Income tax expense 420,000.00 400,000.00 14 Net income $600,000.00 $550,000.00 Marshall Inc. Comparative Balance Sheet December 31, 20Y2 and 20Y1 1 20Y2 20Y1 2 Assets…Marshall Inc. Comparative Income Statement For the Years Ended December 31, 20Y2 and 20Y1 1 20Y2 20Y1 2 Sales $10,850,000.00 $10,000,000.00 3 Cost of goods sold 6,000,000.00 5,450,000.00 4 Gross profit $4,850,000.00 $4,550,000.00 5 Selling expenses $2,170,000.00 $2,000,000.00 6 Administrative expenses 1,627,500.00 1,500,000.00 7 Total operating expenses $3,797,500.00 $3,500,000.00 8 Income from operations $1,052,500.00 $1,050,000.00 9 Other revenue 99,500.00 20,000.00 10 $1,152,000.00 $1,070,000.00 11 Other expense (interest) 132,000.00 120,000.00 12 Income before income tax $1,020,000.00 $950,000.00 13 Income tax expense 420,000.00 400,000.00 14 Net income $600,000.00 $550,000.00 Marshall Inc. Comparative Balance Sheet December 31, 20Y2 and 20Y1 1 20Y2 20Y1 2 Assets…
- Marshall Inc. Comparative Income Statement For the Years Ended December 31, 20Y2 and 20Y1 1 20Y2 20Y1 2 Sales $10,850,000.00 $10,000,000.00 3 Cost of goods sold 6,000,000.00 5,450,000.00 4 Gross profit $4,850,000.00 $4,550,000.00 5 Selling expenses $2,170,000.00 $2,000,000.00 6 Administrative expenses 1,627,500.00 1,500,000.00 7 Total operating expenses $3,797,500.00 $3,500,000.00 8 Income from operations $1,052,500.00 $1,050,000.00 9 Other revenue 99,500.00 20,000.00 10 $1,152,000.00 $1,070,000.00 11 Other expense (interest) 132,000.00 120,000.00 12 Income before income tax $1,020,000.00 $950,000.00 13 Income tax expense 420,000.00 400,000.00 14 Net income $600,000.00 $550,000.00 Marshall Inc. Comparative Balance Sheet December 31, 20Y2 and 20Y1 1 20Y2 20Y1 2 Assets…Marshall Inc. Comparative Income Statement For the Years Ended December 31, 20Y2 and 20Y1 1 20Y2 20Y1 2 Sales $10,850,000.00 $10,000,000.00 3 Cost of goods sold 6,000,000.00 5,450,000.00 4 Gross profit $4,850,000.00 $4,550,000.00 5 Selling expenses $2,170,000.00 $2,000,000.00 6 Administrative expenses 1,627,500.00 1,500,000.00 7 Total operating expenses $3,797,500.00 $3,500,000.00 8 Income from operations $1,052,500.00 $1,050,000.00 9 Other revenue 99,500.00 20,000.00 10 $1,152,000.00 $1,070,000.00 11 Other expense (interest) 132,000.00 120,000.00 12 Income before income tax $1,020,000.00 $950,000.00 13 Income tax expense 420,000.00 400,000.00 14 Net income $600,000.00 $550,000.00 Marshall Inc. Comparative Balance Sheet December 31, 20Y2 and 20Y1 1 20Y2 20Y1 2 Assets…Comparative Income StatementsConsider the following income statement data from the Ross Company: Current Year Previous Year Sales revenue $525,000 $450,000 Cost of goods sold 336,000 279,000 Selling expenses 105,000 99,000 Administrative expenses 60,000 54,000 Income tax expense 7,800 5,400 Prepare a comparative income statement, showing increases and decreases in dollars and in percentages. Note: Round "Percent Change" answers to one decimal place (ex: 0.2345 = 23.5%). ROSS COMPANYComparative Income Statements Current Year Previous Year Increase(Decrease) PercentChange Sales Revenue Answer Answer Answer Answer Cost of Goods Sold Answer Answer Answer Answer Answer Answer Answer Answer Answer Answer Selling Expenses Answer Answer Answer Answer Administrative Expenses Answer Answer Answer Answer Total Answer Answer Answer Answer Income before Income Taxes Answer Answer Answer Answer Answer Answer Answer Answer Answer Answer…
- Selected comparative statement data for Oriole Company are presented below. All balance sheet data are as of December 31. 20222021Net sales$1,165,000 $1,125,000Cost of goods sold705,000 645,000Interest expense20,000 15,000Net income154,945 145,000Accounts receivable145,000 125,000Inventory105,000 100,000Total assets785,000 700,000Preferred stock (6%)205,000 200,000Total stockholders’ equity635,000 525,000 Compute the following ratios for 2022. (Round answers to 1 decimal place, e.g. 1.8 or 2.5%) (a)Profit marginenter the profit margin in percentages %(b)Asset turnoverenter the asset turnover in times times(c)Return on assetsenter the return on assets in percentages %(d)Return on common stockholders’ equityenter the return on common stockholders' equity in percentages %Corporation.Gross income $25,240,000Total sales 24,324,000Total credit sales 18,785,000Net income 2,975,000Cost of goods sold 12,600,000Total assets 10,550,000Average inventory 2,875,000Average receivables 3,445,000a. Compute the receivable turnover ratio.b. Compute the inventory turnover ratio.c. Compute the asset turnover ratio.Revenue and expense data for Searle Technologies Co. are as follows: 20Y8 20Y7 Sales $900,000 $725,000 Cost of goods sold 558,000 435,000 Selling expenses 117,000 116,000 Administrative expenses 63,000 65,250 Income tax expense 76,500 58,000 a. Prepare an income statement in comparative form, stating each item for both 20Y8 and 20Y7 as a percent of sales. Round to one decimal place. Searle Technologies Co. Comparative Income Statement For the Years Ended December 31, 20Y8 and 20Y7 20Y8 Amount 20Y8 Percent 20Y7 Amount 20Y7 Percent $fill in the blank 9441f0095009007_2 fill in the blank 9441f0095009007_3% $fill in the blank 9441f0095009007_4 fill in the blank 9441f0095009007_5% fill in the blank 9441f0095009007_7 fill in the blank 9441f0095009007_8% fill in the blank 9441f0095009007_9 fill in the blank 9441f0095009007_10% Gross profit $fill in the blank 9441f0095009007_11 fill in the blank…