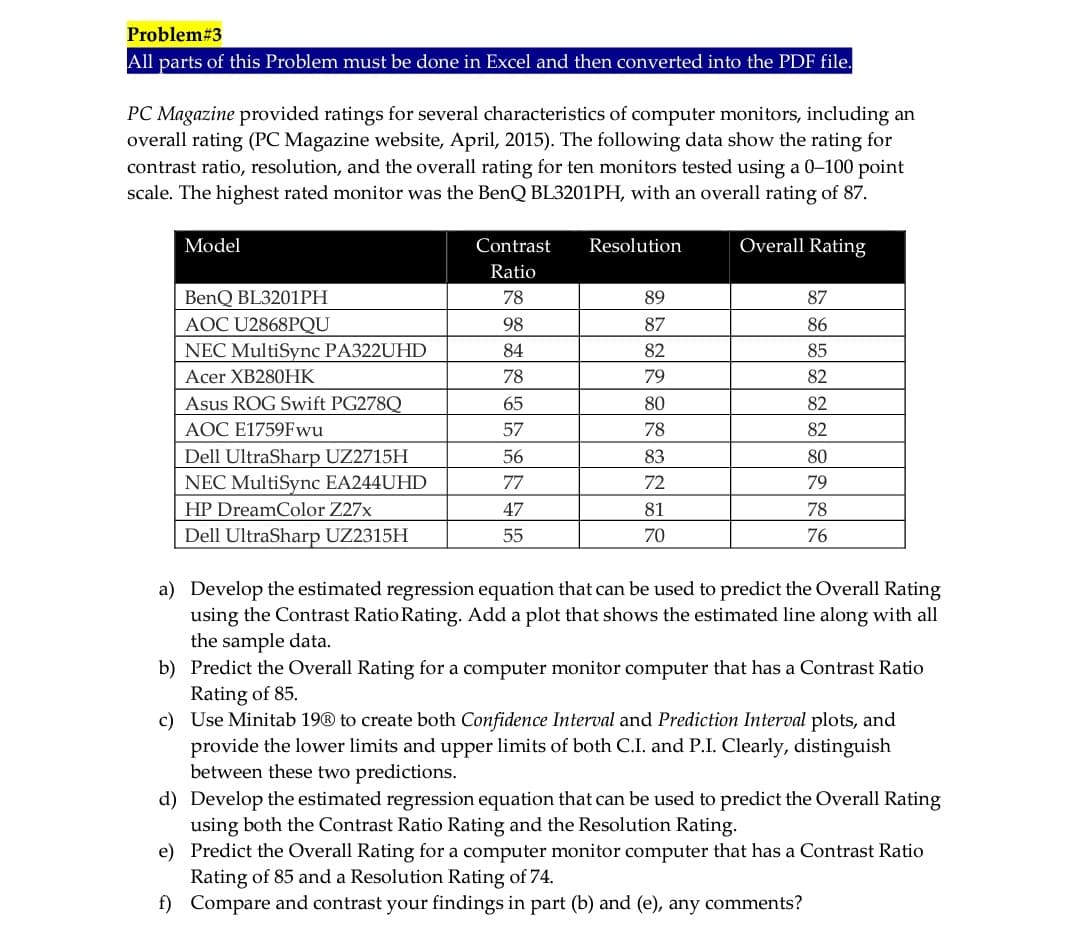
PC Magazine provided ratings for several characteristics of computer monitors, including an overall rating (PC Magazine website, April, 2015). The following data show the rating for contrast ratio, resolution, and the overall rating for ten monitors tested using a 0-100 point scale. The highest rated monitor was the BenQ BL3201PH, with an overall rating of 87. Model Contrast Resolution Overall Rating Ratio 78 BenQ BL3201PH AOC U2868PQU NEC MultiSync PA322UHD 89 87 98 87 86 84 82 85 Acer XB280HK 78 79 82 Asus ROG Swift PG278Q 65 80 82 AOC E1759Fwu 57 78 82 Dell UltraSharp UZ2715H 56 83 80 NEC MultiSync EA244UHD 77 72 79 HP DreamColor Z27x 47 81 78 Dell UltraSharp UZ2315H 55 70 76 a) Develop the estimated regression equation that can be used to predict the Overall Rating using the Contrast Ratio Rating. Add a plot that shows the estimated line along with all the sample data. b) Predict the Overall Rating for a computer monitor computer that has a Contrast Ratio Rating of 85. c) Use Minitab 19® to create both Confidence Interval and Prediction Interval plots, and provide the lower limits and upper limits of both C.I. and P.I. Clearly, distinguish between these two predictions. d) Develop the estimated regression equation that can be used to predict the Overall Rating using both the Contrast Ratio Rating and the Resolution Rating. e) Predict the Overall Rating for a computer monitor computer that has a Contrast Ratio Rating of 85 and a Resolution Rating of 74. f) Compare and contrast your findings in part (b) and (e), any comments?


Family of Curves
A family of curves is a group of curves that are each described by a parametrization in which one or more variables are parameters. In general, the parameters have more complexity on the assembly of the curve than an ordinary linear transformation. These families appear commonly in the solution of differential equations. When a constant of integration is added, it is normally modified algebraically until it no longer replicates a plain linear transformation. The order of a differential equation depends on how many uncertain variables appear in the corresponding curve. The order of the differential equation acquired is two if two unknown variables exist in an equation belonging to this family.
XZ Plane
In order to understand XZ plane, it's helpful to understand two-dimensional and three-dimensional spaces. To plot a point on a plane, two numbers are needed, and these two numbers in the plane can be represented as an ordered pair (a,b) where a and b are real numbers and a is the horizontal coordinate and b is the vertical coordinate. This type of plane is called two-dimensional and it contains two perpendicular axes, the horizontal axis, and the vertical axis.
Euclidean Geometry
Geometry is the branch of mathematics that deals with flat surfaces like lines, angles, points, two-dimensional figures, etc. In Euclidean geometry, one studies the geometrical shapes that rely on different theorems and axioms. This (pure mathematics) geometry was introduced by the Greek mathematician Euclid, and that is why it is called Euclidean geometry. Euclid explained this in his book named 'elements'. Euclid's method in Euclidean geometry involves handling a small group of innately captivate axioms and incorporating many of these other propositions. The elements written by Euclid are the fundamentals for the study of geometry from a modern mathematical perspective. Elements comprise Euclidean theories, postulates, axioms, construction, and mathematical proofs of propositions.
Lines and Angles
In a two-dimensional plane, a line is simply a figure that joins two points. Usually, lines are used for presenting objects that are straight in shape and have minimal depth or width.
I want d), e), f)


Trending now
This is a popular solution!

Step by step
Solved in 2 steps with 2 images


