The National Football League (NFL) records a variety of performance data for individuals and teams. To investigate the importance of passing on the percentage of games won by a team, the following data show the average number of passing yards per attempt (Yards/Attempt) and the percer games won (WinPct) for a random sample of 10 NFL teams for the 2011 season. Team Yards/Attempt WinPct Arizona Cardinals 6.5 s0 Atlanta Falcons 7.1 63 Carolina Panthers 7.4 38 Chicago Bears 6.4 50 Dallas Cowboys 7.4 50 New England Patriots 8.3 81 Philadelphia Eagles 7.4 50 Seattle Seahawks 6.1 44 St. Louis Rams 5.2 13 Tampa Bay Buccaneers 6.2 25 (a) Develop a scatter diagram with the number of passing yards per attempt on the horizontal axis and the percentage of games won on the vertical axis. 90 90 90 90 80 80- 80 80 70 70 60 70 70 60 60 60 50 E 40 50 E 40 30 .. : 50 50 40 40- 30 30 30- 20 20 20 20 10- 10 10 10 5 5 6 8 7 5 6 Yards/Attempt Yards/Attempt Yards/Attempt Yards/Attempt
The National Football League (NFL) records a variety of performance data for individuals and teams. To investigate the importance of passing on the percentage of games won by a team, the following data show the average number of passing yards per attempt (Yards/Attempt) and the percer games won (WinPct) for a random sample of 10 NFL teams for the 2011 season. Team Yards/Attempt WinPct Arizona Cardinals 6.5 s0 Atlanta Falcons 7.1 63 Carolina Panthers 7.4 38 Chicago Bears 6.4 50 Dallas Cowboys 7.4 50 New England Patriots 8.3 81 Philadelphia Eagles 7.4 50 Seattle Seahawks 6.1 44 St. Louis Rams 5.2 13 Tampa Bay Buccaneers 6.2 25 (a) Develop a scatter diagram with the number of passing yards per attempt on the horizontal axis and the percentage of games won on the vertical axis. 90 90 90 90 80 80- 80 80 70 70 60 70 70 60 60 60 50 E 40 50 E 40 30 .. : 50 50 40 40- 30 30 30- 20 20 20 20 10- 10 10 10 5 5 6 8 7 5 6 Yards/Attempt Yards/Attempt Yards/Attempt Yards/Attempt

Glencoe Algebra 1, Student Edition, 9780079039897, 0079039898, 2018
18th Edition
ISBN:9780079039897
Author:Carter
Publisher:Carter
Chapter10: Statistics
Section10.6: Summarizing Categorical Data
Problem 10CYU

Related questions

Topic Video
Question
q 21 part a
Transcribed Image Text:The National Football League (NFL) records a variety of performance data for individuals and teams. To investigate the importance of passing on the percentage of games won by a team, the following data show the average number of passing yards per attempt (Yards/Attempt) and the percent
games won (WinPct) for a random sample of 10 NFL teams for the 2011 season.t
Team
Yards/Attempt
WinPct
Arizona Cardinals
6.5
50
Atlanta Falcons
7.1
63
Carolina Panthers
7.4
38
Chicago Bears
6.4
50
Dallas Cowboys
7.4
50
New England Patriots
8.3
81
Philadelphia Eagles
7.4
50
Seattle Seahawks
6.1
44
St. Louis Rams
5.2
13
Tampa Bay Buccaneers
6.2
25
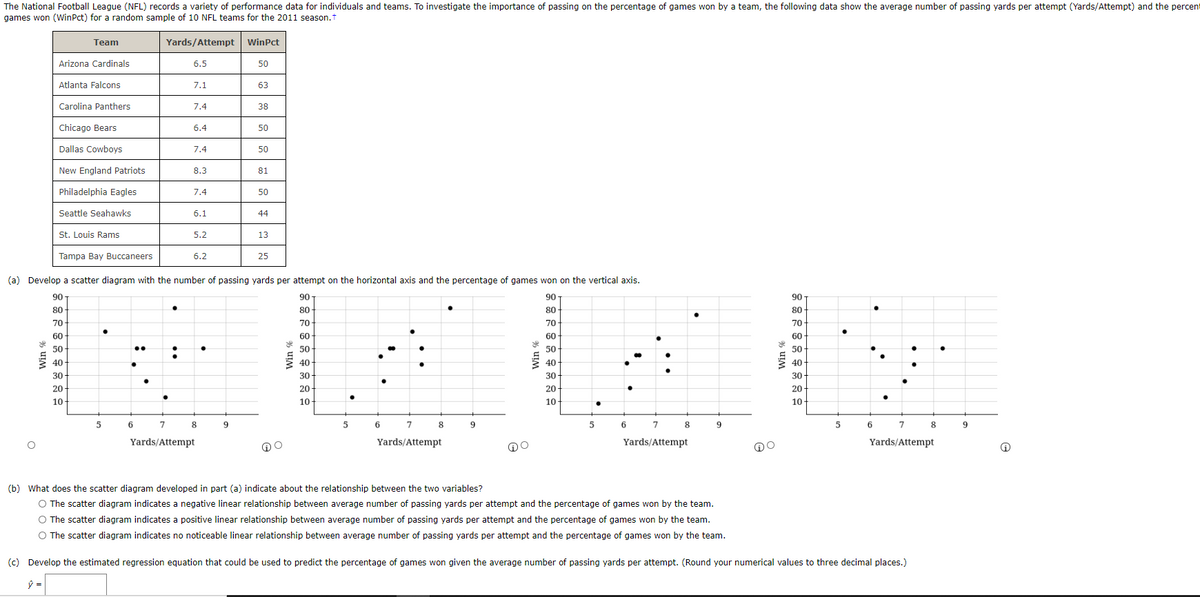
(a) Develop a scatter diagram with the number of passing yards per attempt on the horizontal axis and the percentage of games won on the vertical axis.
90
90
90
90
80
80
80
80
70
70
70
70
60
60
60-
60
50
50
50
50
40
40
40
40
30
30
30
30
20
20
20
20
10
10-
10
10
6.
7
8
9
6.
8.
9.
6.
8
9
6.
7
8
9.
Yards/Attempt
Yards/Attempt
Yards/Attempt
Yards/Attempt
(b) What does the scatter diagram developed in part (a) indicate about the relationship between the two variables?
O The scatter diagram indicates a negative linear relationship between average number of passing yards per attempt and the percentage of games won by the team.
O The scatter diagram indicates a positive linear relationship between average number of passing yards per attempt and the percentage of games won by the team.
O The scatter diagram indicates no noticeable linear relationship between average number of passing yards per attempt and the percentage of games won by the team.
(c) Develop the estimated regression equation that could be used to predict the percentage of games won given the average number of passing yards per attempt. (Round your numerical values to three decimal places.)
Win
Expert Solution
This question has been solved!
Explore an expertly crafted, step-by-step solution for a thorough understanding of key concepts.

This is a popular solution!

Trending now
This is a popular solution!

Step by step
Solved in 2 steps with 1 images

Knowledge Booster


Learn more about
Need a deep-dive on the concept behind this application? Look no further. Learn more about this topic, statistics and related others by exploring similar questions and additional content below.Recommended textbooks for you
Glencoe Algebra 1, Student Edition, 9780079039897…
Algebra
ISBN:
9780079039897
Author:
Carter
Publisher:
McGraw Hill
Glencoe Algebra 1, Student Edition, 9780079039897…
Algebra
ISBN:
9780079039897
Author:
Carter
Publisher:
McGraw Hill