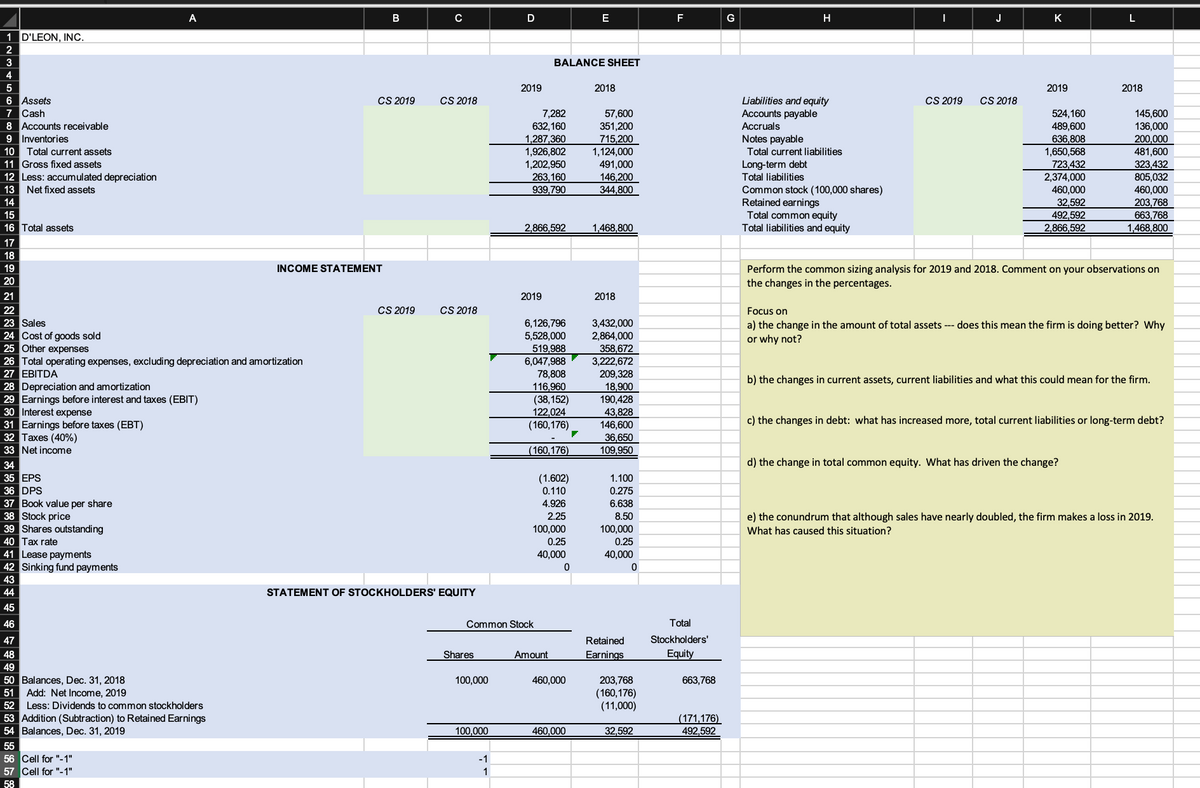
Perform the common sizing analysis for 2019 and 2018. Comment on your observations on the changes in the percentages. Focus on a) the change in the amount of total assets --- does this mean the firm is doing better? Why or why not? b) the changes in current assets, current liabilities and what this could mean for the firm. c) the changes in debt: what has increased more, total current liabilities or long-term debt? d) the change in total common equity. What has driven the change? e) the conundrum that although sales have nearly doubled, the firm makes a loss in 2019. What has caused this situation?
Perform the common sizing analysis for 2019 and 2018. Comment on your observations on the changes in the percentages. Focus on a) the change in the amount of total assets --- does this mean the firm is doing better? Why or why not? b) the changes in current assets, current liabilities and what this could mean for the firm. c) the changes in debt: what has increased more, total current liabilities or long-term debt? d) the change in total common equity. What has driven the change? e) the conundrum that although sales have nearly doubled, the firm makes a loss in 2019. What has caused this situation?

Chapter1: Financial Statements And Business Decisions
Section: Chapter Questions
Problem 1Q

Related questions
Question
100%
Perform the common sizing analysis for 2019 and 2018. Comment on your observations on the changes in the percentages.
Focus on
a) the change in the amount of total assets --- does this mean the firm is doing better? Why or why not?
b) the changes in current assets, current liabilities and what this could mean for the firm.
c) the changes in debt: what has increased more, total current liabilities or long-term debt?
d) the change in total common equity. What has driven the change?
e) the conundrum that although sales have nearly doubled, the firm makes a loss in 2019. What has caused this situation?
Transcribed Image Text:A
C
E
F
G
J
K
1 D'LEON, INC.
3
BALANCE SHEET
4
5
2019
2018
2019
2018
CS 2019
6 Assets
7 Cash
8 Accounts receivable
9 Inventories
10 Total current assets
11 Gross fixed assets
12 Less: accumulated depreciation
13 Net fixed assets
CS 2018
Liabilities and equity
Accounts payable
CS 2019
CS 2018
7,282
632,160
1,287,360
1,926,802
1,202,950
263,160
939,790
57,600
351,200
715,200
1,124,000
491,000
146,200
344,800
524,160
489,600
636,808
1,650,568
723,432
2,374,000
460,000
145,600
136,000
200,000
481,600
323,432
805,032
460,000
203,768
663,768
1,468,800
Accruals
Notes payable
Total current Iliabilities
Long-term debt
Total liabilities
Common stock (100,000 shares)
Retained earnings
Total common equity
Total liabilities and equity
14
32.592
15
16 Total assets
492,592
2,866,592
2,866,592
1,468,800
17
18
19
INCOME STATEMENT
Perform the common sizing analysis for 2019 and 2018. Comment on your observations on
the changes in the percentages.
20
21
2019
2018
22
CS 2019
CS 2018
Focus on
23 Sales
24 Cost of goods sold
25 Other expenses
26 Total operating expenses, excluding depreciation and amortization
27 EBITDA
28 Depreciation and amortization
29 Earnings before interest and taxes (EBIT)
30 Interest expense
31 Earnings before taxes (EBT)
32 Taxes (40%)
33 Net income
6,126,796
5,528,000
519,988
6,047,988
78,808
116,960
(38,152)
122,024
(160,176)
3,432,000
2,864,000
358,672
3,222,672
209,328
18,900
190,428
43,828
146,600
36,650
109,950
a) the change in the amount of total assets --- does this mean the firm is doing better? Why
or why not?
b) the changes in current assets, current liabilities and what this could mean for the firm.
c) the changes in debt: what has increased more, total current liabilities or long-term debt?
(160,176)
34
d) the change in total common equity. What has driven the change?
35 EPS
36 DPS
37 Book value per share
38 Stock price
39 Shares outstanding
40 Tax rate
41 Lease payments
42 Sinking fund payments
(1.602)
0.110
1.100
0.275
4.926
6.638
8.50
100,000
0.25
2.25
e) the conundrum that although sales have nearly doubled, the firm makes a loss in 2019.
100,000
0.25
What has caused this situation?
40,000
40,000
43
44
STATEMENT OF STOCKHOLDERS' EQUITY
45
46
Common Stock
Total
47
Retained
Stockholders'
48
Shares
Amount
Earnings
Equity
49
50 Balances, Dec. 31, 2018
Add: Net Income, 2019
100,000
460,000
203,768
(160,176)
(11,000)
663,768
51
52
Less: Dividends to common stockholders
53 Addition (Subtraction) to Retained Earnings
54 Balances, Dec. 31, 2019
(171,176)
492,592
100,000
460,000
32,592
55
56 Cell for "-1"
57 Cell for "-1"
-1
1
58
Transcribed Image Text:STATEMENT OF CASH FLOWS
2019
1 Operating Activities
Net Income
(160,176)
116,960
378,560
353,600
(280,960)
(572,160)
(164,176)
Depreciation and amortization
Increase in accounts payable
Increase in accruals
Increase in accounts receivable
Increase in inventories
Net cash provided by operating activities
O Long-Term Investing Activities
Additions to property, plant, and equipment
Net cash used in investing activities
(711,950)
(711,950)
4 Financing Activities
Increase in notes payable
Increase in long-term debt
Payment of cash dividends
Net cash provided by financing activities
436,808
400,000
(11,000)
825,808
O Summary
1 Net decrease in cash
2 Cash at beginning of the year
B Cash at end of the year
(50,318)
57,600
7,282
Expert Solution
This question has been solved!
Explore an expertly crafted, step-by-step solution for a thorough understanding of key concepts.

This is a popular solution!

Trending now
This is a popular solution!

Step by step
Solved in 2 steps

Knowledge Booster


Learn more about
Need a deep-dive on the concept behind this application? Look no further. Learn more about this topic, accounting and related others by exploring similar questions and additional content below.Recommended textbooks for you

Accounting
Accounting
ISBN:
9781337272094
Author:
WARREN, Carl S., Reeve, James M., Duchac, Jonathan E.
Publisher:
Cengage Learning,

Accounting Information Systems
Accounting
ISBN:
9781337619202
Author:
Hall, James A.
Publisher:
Cengage Learning,
Accounting
Accounting
ISBN:
9781337272094
Author:
WARREN, Carl S., Reeve, James M., Duchac, Jonathan E.
Publisher:
Cengage Learning,
Accounting Information Systems
Accounting
ISBN:
9781337619202
Author:
Hall, James A.
Publisher:
Cengage Learning,

Horngren's Cost Accounting: A Managerial Emphasis…
Accounting
ISBN:
9780134475585
Author:
Srikant M. Datar, Madhav V. Rajan
Publisher:
PEARSON

Intermediate Accounting
Accounting
ISBN:
9781259722660
Author:
J. David Spiceland, Mark W. Nelson, Wayne M Thomas
Publisher:
McGraw-Hill Education

Financial and Managerial Accounting
Accounting
ISBN:
9781259726705
Author:
John J Wild, Ken W. Shaw, Barbara Chiappetta Fundamental Accounting Principles
Publisher:
McGraw-Hill Education