
Essentials Of Investments
11th Edition
ISBN:9781260013924
Author:Bodie, Zvi, Kane, Alex, MARCUS, Alan J.
Publisher:Bodie, Zvi, Kane, Alex, MARCUS, Alan J.
Chapter1: Investments: Background And Issues
Section: Chapter Questions
Problem 1PS

Related questions
Question
Discuss on Credit Risk of Nordstrom
Time-series analysis
Analyze credit risk in the past and current years (You may obtain information about firms’ credit ratings from financial articles as well); trend analysis
Cross-sectional analysis
- How do you think about current and
Discuss on Profitability:
- Time-series analysis
Analyze profitability in the past and current years;
Can you find patterns or trends over the three years?
Cross-sectional analysis
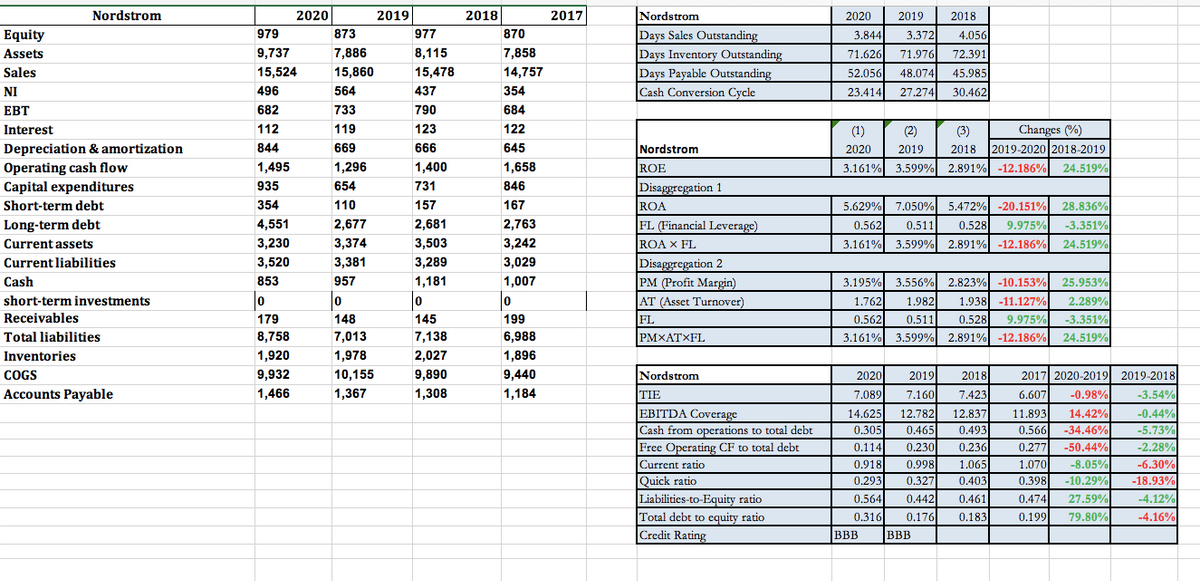
Transcribed Image Text:Nordstrom
2020
2019
2018
2017
Nordstrom
2020
2019
2018
873
977
870
Days Sales Outstanding
Days Inventory Outstanding
Days Payable Outstanding
Cash Conversion Cycle
Equity
979
3.844
3.372
4.056
Assets
9,737
7,886
8,115
7,858
71.626
71.976
72.391
Sales
15,524
15,860
15,478
14,757
52.056
48.074
45.985
NI
496
564
437
354
23.414
27.274
30.462
EBT
682
733
790
684
Interest
112
119
123
122
(1)
(2)
(3)
Changes (%)
Depreciation & amortization
Operating cash flow
Capital expenditures
844
669
666
645
Nordstrom
2020
2019
2018
2019-2020 2018-2019
1,495
1,296
1,400
1,658
ROE
3.161% 3.599% 2.891% -12.186%
24.519%
935
654
731
846
Disaggregation 1
Short-term debt
354
110
157
167
ROA
5.629%
7.050%
5.472% -20.151%
28.836%
Long-term debt
4,551
2,677
2,681
2,763
FL (Financial Leverage)
9.975%
-3.351%
0.562
0.511
0.528
Current assets
3,230
3,374
3,503
3,242
ROA x FL
3.161%
3.599% 2.891% -12.186%
24.519%
3,520
3,381
3,289
3,029
Disaggregation 2
PM (Profit Margin)
Current liabilities
Cash
853
957
1,181
1,007
3.195%
3.556% 2.823% -10.153%
25.953%
short-term investments
AT (Asset Turnover)
1.762
1.982
1.938 -11.127%
2.289%
Receivables
179
148
145
199
0.528
-3.351%
FL
PMXATXFL
0.562
0.511
9.975%
Total liabilities
8,758
7,013
7,138
6,988
3.161% 3.599% 2.891%| -12.186%
24.519%
Inventories
1,920
1,978
2,027
1,896
COGS
9,932
10,155
9,890
9,440
Nordstrom
2020
2019
2018
2017 2020-2019 2019-2018
Accounts Payable
1,466
1,367
1,308
1,184
7.423
-0.98%
14.42%
TIE
7.089
7.160
6.607
-3.54%
-0.44%
-5.73%
-2.28%
EBITDA Coverage
14.625
12.782
12.837
11.893
Cash from operations to total debt
Free Operating CF to total debt
Current ratio
Quick ratio
Liabilities-to-Equity ratio
0.305
0.465
0.493
0.566
-34.46%
0.114
0.230
0.236
0.277
-50.44%
0.918
0.998
1.065
1.070
-8.05%
-6.30%
0.293
0.327
0.403
0.398
-10.29%
-18.93%
27.59%
-4.12%
-4.16%
0.564
0.442
0.461
0.474
Total debt to equity ratio
0.316
0.176
0.183
0.199
79.80%
Credit Rating
BBB
BBB
Expert Solution
This question has been solved!
Explore an expertly crafted, step-by-step solution for a thorough understanding of key concepts.

This is a popular solution!

Trending now
This is a popular solution!

Step by step
Solved in 3 steps

Knowledge Booster


Learn more about
Need a deep-dive on the concept behind this application? Look no further. Learn more about this topic, finance and related others by exploring similar questions and additional content below.Recommended textbooks for you
Essentials Of Investments
Finance
ISBN:
9781260013924
Author:
Bodie, Zvi, Kane, Alex, MARCUS, Alan J.
Publisher:
Mcgraw-hill Education,


Essentials Of Investments
Finance
ISBN:
9781260013924
Author:
Bodie, Zvi, Kane, Alex, MARCUS, Alan J.
Publisher:
Mcgraw-hill Education,

Foundations Of Finance
Finance
ISBN:
9780134897264
Author:
KEOWN, Arthur J., Martin, John D., PETTY, J. William
Publisher:
Pearson,

Fundamentals of Financial Management (MindTap Cou…
Finance
ISBN:
9781337395250
Author:
Eugene F. Brigham, Joel F. Houston
Publisher:
Cengage Learning

Corporate Finance (The Mcgraw-hill/Irwin Series i…
Finance
ISBN:
9780077861759
Author:
Stephen A. Ross Franco Modigliani Professor of Financial Economics Professor, Randolph W Westerfield Robert R. Dockson Deans Chair in Bus. Admin., Jeffrey Jaffe, Bradford D Jordan Professor
Publisher:
McGraw-Hill Education