Please find the Asset Beta (IndustryBeta) based on the following information below: Currently, Ljutic A/I Inc. has hired a consulting firm (Oakland Association-OA) to estimate the size of the market and hence expected unit sales for its main product (E-toral application sensor). OA’s work resulted in unit sales estimates of 318,331, 341,342, 368,769, 383,432, and 376,532 units respectively for the next five years conditioned on Ljutic adhering to an average sales price of $568 per unit for the first two years and $387 in years three, four, and five. From that point going forward, growth in unit sales is predicted to be 2.72% indefinitely. The results of an independent outside analysis by a leading market research firm has determined that the company can manufacture its product line at a variable cost per unit expected to be $63.47 growing at 2.23% per year for the first 5 years and 3.17% per year indefinitely thereafter while overall fixed costs are estimated to be $10,482,000 annually for the first year and then grow 2.97% per year indefinitely. The necessary capital expenditures are projected to be $31,673,500 upfront and due to the nature of the investments that Ljutic A/I Inc. makes, it is deemed by the IRS to be depreciated on the five-year MACRS schedule. In the terminal phase of growth, it is projected that investment strategy will morph into and likely change to that of a support structure for AI/AR opportunities closely aligned with cyber security applications as service revenues become more annuitized. Working capital to support sales is estimated to be 15.65% of yearly sales for the first 5 years and then is projected to slow to a 4.59% annual growth rate thereafter. The marginal corporate income tax rate is expected to average 23.67% barring any changes to the corporate tax code and the projected annual growth rate of Free Cash Flow (FCF) in the terminal phase is expected to grow approximately 1% more than the current risk-free rate of return indefinitely. Historically, the debt-equity ratio has averaged roughly 116% for which Ljutic A/I Inc.’s current debt level is $39,889,950 with an average maturity of 6 years and an interest rate on this debt averaging 8.175%. Upon a regression analysis, the historical equity Beta was calculated to be 2.067, while the risk-free rate of return is given as 2.876% and the market rate of return is assumed to be 12.45%. Currently there are 3,231,443 shares of common stock outstanding.


Please find the Asset Beta (IndustryBeta) based on the following information below:
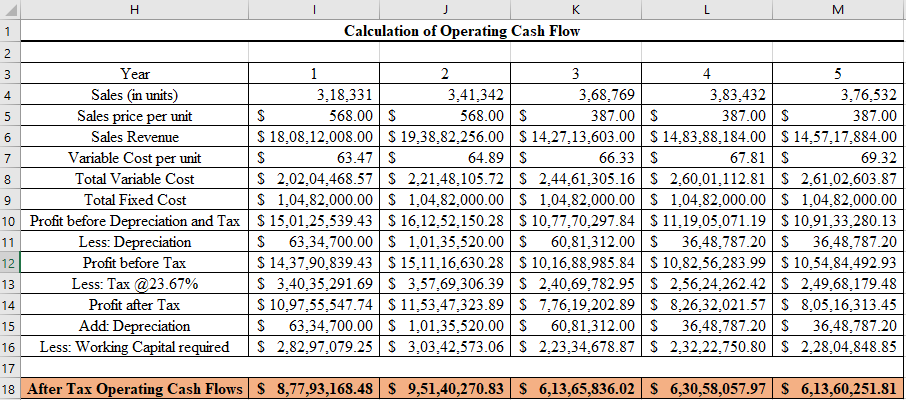
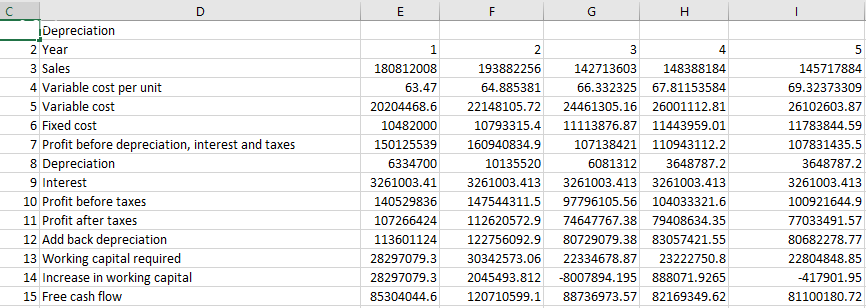
Currently, Ljutic A/I Inc. has hired a consulting firm (Oakland Association-OA) to estimate the size of the market and hence expected unit sales for its main product (E-toral application sensor). OA’s work resulted in unit sales estimates of 318,331, 341,342, 368,769, 383,432, and 376,532 units respectively for the next five years conditioned on Ljutic adhering to an average sales price of $568 per unit for the first two years and $387 in years three, four, and five. From that point going forward, growth in unit sales is predicted to be 2.72% indefinitely.
The results of an independent outside analysis by a leading
The necessary capital expenditures are projected to be $31,673,500 upfront and due to the nature of the investments that Ljutic A/I Inc. makes, it is deemed by the IRS to be
Working capital to support sales is estimated to be 15.65% of yearly sales for the first 5 years and then is projected to slow to a 4.59% annual growth rate thereafter. The marginal corporate income tax rate is expected to average 23.67% barring any changes to the corporate tax code and the projected annual growth rate of
Historically, the debt-equity ratio has averaged roughly 116% for which Ljutic A/I Inc.’s current debt level is $39,889,950 with an average maturity of 6 years and an interest rate on this debt averaging 8.175%. Upon a regression analysis, the historical equity Beta was calculated to be 2.067, while the risk-free rate of return is given as 2.876% and the market rate of return is assumed to be 12.45%. Currently there are 3,231,443 shares of common stock outstanding.


Trending now
This is a popular solution!

Step by step
Solved in 2 steps


