PPF Education 1.1.1 Define the curve AF. 1.1.2. Explain the following points in relation to the curve and the basic economic problem of scarcity. 1.1.2.1 Point B 1.1.22 The move from Point B to Point C 1.1.2.3 Points inside the curve 1.1.2.4 Points outside the curve


Q: 4. Production Possibility Frontier An economy consists of three workers: Rajiv, Yakov, and Charles.…
A: Total number of working hours in a day= 10 hours Services provided by them; Mowing lawns Washing…
Q: Question 1 Suppose a British Columbia has a total of 12 units of labour, which can be used to…
A: Shortage in financial matters alludes to when the interest for an asset is more prominent than the…
Q: PP PP PP Consumer Goods Refer to the diagram. An improvement in technology will shift the production…
A: Production possibility curve: - it is the graphical representation of different combinations of two…
Q: Between a straight line PPF and concave PPF, which one is more realistic? Why? Defend your answer.
A: Straight line PPF means that the opportunity cost remains same at all points whereas a concave…
Q: The table below sets out the production possibilities of a small Pacific island economy. An economy…
A: Production possibility curve shows the combination of two goods that can be produced with the given…
Q: Discuss the basic economic problem of scarcity. Be sure to include a definition of the term, how it…
A: Basic Economic problem of Scarcity: One of the most fundamental economic issues we experience is…
Q: The table below shows the Production possibilities for an economy Production Alternatives Capital…
A: Since you have asked a question with multiple sub-parts, we will solve first three sub-parts for…
Q: Q.1.1 What is the cause of scarcity in the economy? (a) Limited wants and unlimited resources. (b)…
A: Note: We’ll answer the first three questions since the exact one wasn’t specified. Please submit a…
Q: Suppose a nation has a total of 12 units of labor, which can be used to produce either guns or…
A: Hi, thanks for the question. Since there are multiple subparts, we will answer for the first three…
Q: Q.1.1 What is the cause of scarcity in the economy? (a) Limited wants and unlimited resources. (b)…
A: Economics is the branch of knowledge in which we study the scarcity, demand and supply, production,…
Q: What are the two major ways in which an economy can grow and push out its production possibilities…
A: The production possibilities curve denotes the maximum output that an economy can produce at its…
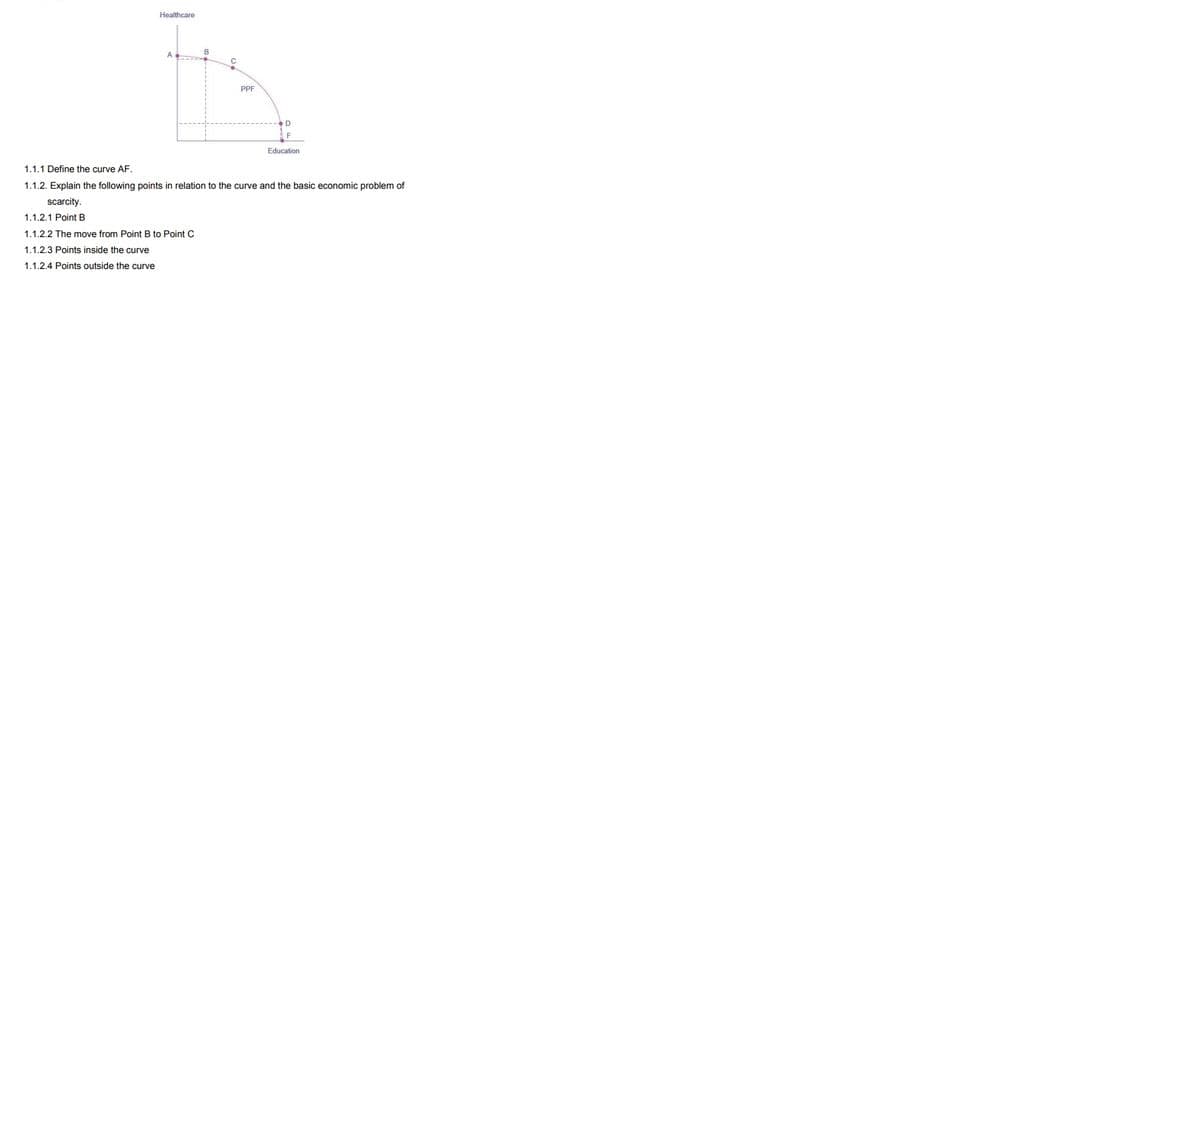
Q: Healthcare PPF Education 1.1.1 Define the curve AF. 1.1.2. Explain the following points in relation…
A: Curve AF is a production possibility curve which shows the combination of Healthcare and Education…
Q: In Victoria. In Queenslan 4.12.1 Which form of scarcity is depicted in Victoria in the picture…
A: 12.1 - Victoria is facing water scarcity which reached stage 4. Under Stage 4, there are many…
Q: Referring to the table, suppose improvement occurs in the technology of producing forklifts but not…
A: As there was a technological improvement in the forklifts, the PPC of forklifts will shift to left
Q: Graph 1: Draw a production possibilities model with 4 points labelled A, B, C, D, one inside, two…
A: Production Possibility Curve: It refers to the graphical representation of the maximum units of two…
Q: During the American Civil War, the South’s factories and farm land were decimated. It also suffered…
A: The production possibility curve shows the combinations of outcome/output a firm can produce by…
Q: Q3. Why is there scarcity? A. Because the opportunity set determines this. B. Because theory…
A: Resources are used as raw materials for the production of goods, and it is very important that a…
Q: Exhibit 2-10 production possibilities curve data A B C D E Capital Goods 0 1 2 3 4 Consumption…
A: When an economy is faced with the production possibility table as given in the Exhibit 2-10. As…
Q: Why is the economic concept of scarcity a crucial onefor businesspeople to understand?
A: Economics as a subject is used to study and plan the allocation of scarce resources among humans…
Q: Explain how scarcity affects the factors of production.
A: scarcity is the point at which an asset is totally gone or is coming up short. at the point when…
Q: 1 2 F B D Consumer Goods Refer to the above diagram. A shift in the production possibilities curve…
A: Production possibility curve is the locus of different combinations of two goods that an economy can…
Q: Orange(tons) Apple(tons) A 1400 0 B 1100 450 C 900 900 D 600…
A: “Since you have asked multiple questions, we will solve the first question for you. If you want any…
Q: le.courses.open.uwi.edu/mod/quiz/attempt.php?attempt=D11017&cmid%3D16128&page%3D4 change 2021…
A: In Economics, the scarcity problem arises from the fact that resources are limited while human wants…
Q: 10. Because of scarcity, for every choice we make, there will always be opportunity costs. What does…
A: (B)
Q: s how the production possibility frontier demonstrates the basic economic problem of scarcity
A: The PPF (production possibility frontier) is a locus that represents various bundles of commodities…
Q: Atte Thinking about scarcity in terms of the economic way of thinking, why does scarcity exist?…
A: Answer: Scarcity occurs due to the unlimited wants of people and limited resources. When the limited…
Q: 4. The economy of econ151 gets into a war with the economy of econ 150 and destroys 30% of econ…
A: Production possibility frontier (PPF) shows a probable combination of two commodities produced in an…
Q: Explain how scarcity is determined in our economy
A: Scarcity is well defined when ends available to fulfill the need are limited and not easily…
Q: The Principle of Opportunity Cost Apply the principle of opportunity cost. 1.1 Consider Figure 2.1…
A: Opportunity Cost: It is the gain or benefit from the next best alternative that a person has given…
Q: Suppose a nation has a total of 12 units of labor, which can be used to produce either guns or…
A: “Since you have posted a question with multiple sub-parts, we will solve first three subparts for…
Q: Economics is the social science that studies the choices that individuals, businesses, governments,…
A: One of the most important concepts, which is the reason why the individuals face the dilemma of…
Q: 15 PP PP PP Consumer Goods Refer to the diagram. An improvement in technology will: A. shift the…
A: A PPC (Production Possibility Curve) is a graphical representation of various combinations of output…
Q: Types of Production C Automobiles 6. Missiles 30 27 21 12 1. Draw a production possibilities curve…
A: Production possibility curve depicts the combination of two goods that a nation can produce by using…
Q: Economists use economic models to replicate real life situations for economic policy. Production…
A: Production possibilities frontier is a curve which represents all possible combinations of two…
Q: Identify the elements of scarcity, choice, and opportunity cost in each of the following: 1. The…
A: Scarcity refers to the scarce or the unavailability of the resources and inputs to produce a certain…
Q: If, next year, the production possibilities curve passes through point W on which point on this…
A: Production Possibility curve is the locus of different combinations of two goods that a country can…
Q: Discuss a consequence scarcity has on our lives. Ideas that you may want to consider and discuss are…
A: Scarcity refers to the limited availability of resources that have unlimited wants and alternative…
Q: Suppose a nation has a total of 12 units of labor, which can be used to produce either guns or…
A: Total units of labor= 12 units Goods produced in the nation:- Guns Butter Guns 0 1 2 Butter 6…

Step by step
Solved in 2 steps


- “The consumption function and budget constraints explained are useful elements inunderstanding the microeconomic approach to health spending.” With the use ofappropriate graphs and mathematical expressions, critically evaluate this statement.1.Briefly explain the bidirectional relationship between Wealth and health. 2. Briefly explain the non-linear relationship between income and health Statuswhat is the relationship of macroeconomics to health economics? give the importance of its relationship.
- Case Study: Inequality, Poverty and WealthA study reported in 2001 discovered that relatively poor people give more generously to charitythan those with greater wealth. The project, entitled “The Widow’s Might: How CharitiesDepend on the Poor”, was conducted by Beth Egan of the Social Market Foundation, whoexamined the contributions of over 1000 individuals to ten British charities. It was found thatalthough richer people gave more money in absolute terms, this comprised a smallerproportion of their overall income than was the case for the poor: in other words, the lower aperson’s income, the more of their earnings they donated to charity. For example, those withan annual income of under £5000 gave away an average of 4.5% in donations, whereas forthose with salaries of over £40,000, the figure was only 2%. The journalist Lucy Ward suggeststhat this challenges the assumption most of us hold that charities redistribute income from therich to the poor: instead, it would seem that…Briefly explain the non-linear relationship between income levels and health Status.What is the SIGNIFICANCE OF STUDY of "The Impact of the Pandemic on Cost of Living between Different Income Level"?
- Assuming a chocolate bar costs $4 each and a bottle of wine $25. a) Graphically depict (and provide an appropriate title) the behavior of the following three individuals according to a model we have studied and then given information: Alex with an income $1000, Sandra with an income of $750, and Bo with an income of $1200. b) Can you indicate the level of actual consumption given the information in the problem? If yes, why? If no, why not?Health care spending growth is outpacing spending growth in other sectors of theeconomy, growing from 5% of GDP to 17.9% in 2016. Spending growth can arise from anincrease in the quantity of care, an increase in the price of care, or both. a. Give two reasons why the quantity of health care consumed has increased over time.Explain. b. Since 1980, the price of medical care has increased 6.7 times as measured by the medicalcare consumer price index. Explain why it is difficult to track changes in prices formedical care. c. Consumers may benefit if price increases reflect an increase in the quality of medicalcare, but may be hurt if price increases do not reflect an increase in quality. For example,in 2015 Turing Pharmaceuticals raised the price of toxoplasmosis treatment Daraprim byover 5000%, from $13.50 to $750 per pill. Using a diagram of supply and demand, showhow a price increase initiated by suppliers can make consumers worse off when there isno accompanying quality increase. On…Find evidence that can explain how the difference in GDP influences the health of people who reside in that country. Here, you are identifying a determinant of health and at least one risk factor. Summarize what you found and justify the determinant of health and risk factor. Cite in - in text citation . explain in 4 sentences or more.
- How comprehensive income is measured according to Haig Simon's definition?What is real GPD? Why do economists prefer to use that as a measurement over regular GPD? Explain.Quality Health Care in the U. S. In his inauguration address, U. S. President Barack Obama mentioned the poor state of the U. S. health care system as a fundamental issue facing the nation and his administration. The sobering truth of America’s health care system is that it dramatically under-performs. In an August 2008 poll by the Commonwealth Fund, 8 of 10 adults agreed with the statement that the health care system “needs either fundamental change or complete rebuilding”. This becomes even clearer when comparing the system with those of its international peers. In 2000, the World Health Organization ranked the performance of the U. S. health care system 37th in the world. In this and other international comparisons, despite spending more than twice per capita than other developed countries, the U. S. were beaten on virtually every metric of health care cost, quality and access. In other words, they spend more and get less. Scoring the U. S. health care system on key benchmarks…