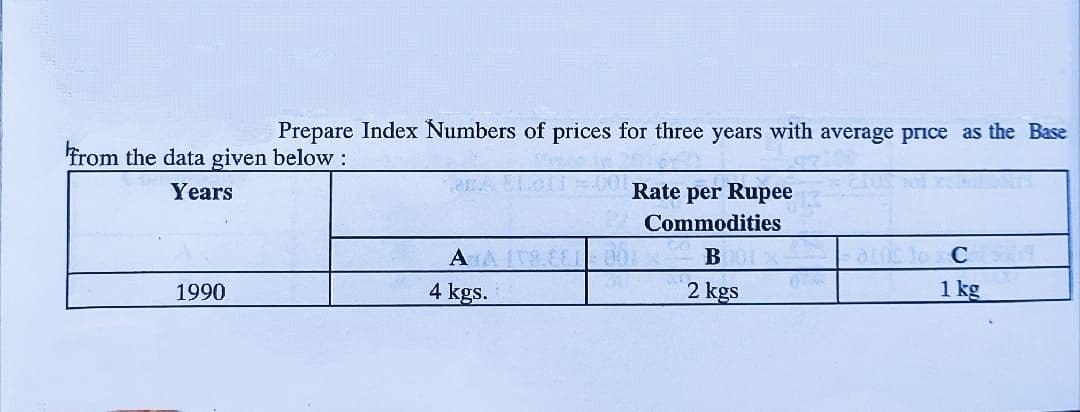
Prepare Index Numbers of prices for three years with average price as the Base Trom the data given below: Years Rate per Rupee Commodities A C 1990 4 kgs. 2 kgs 1 kg


Q: Fruit prices and the amounts consumed for 2014 and 2019 are below. Use 2014 as the base. - Item 2014…
A: Fruit Price - 2014 quantity - 2014 Price - 2019 Quantity - 2019 Bananas 0.23 100 0.69 120 Apples…
Q: The following data are the last three years of quarterly sales ($ thousands) for AmeriWeld. They are…
A: Given that -
Q: When a survey uses the responses strongly disagree, disagree, neutral, agree, strongly agree, this…
A: Data in statistics are divided into 4 types such as 1. Nominal data : data values are non numeric…
Q: Campus Advising needs to allocate time this week for office appointments, so she needs to forecast…
A:
Q: The accompanying data represent the monthly rate of return of a certain company's common stock for…
A: Introduction: Denote Q1, Q2, Q3 as the three quartiles of the given distribution of scores in the…
Q: Select the things that INCREASE power. Check all that apply. O Decrease Alpha Increase Alpha O…
A: Hypothesis testing is a methodology in which an assumption is tested based on a population…
Q: SOCI 2004: Introduction to Population 1. Given the data in Table 1 for Jamaica 1980-1985 and…
A: Population 1980-85 2000-2005 Beginning 2123400 2581700 End 2325700 2661000 Total Births 294900…
Q: The population of a small country by year is shown in the table below. Year 1955 1960 Population…
A: If population of a city x in 1950 and y in 1960 then absolute change of population=(y-x) As per our…
Q: The population parameters below describe the full-time equivalent number of students (FTES) each…
A: The population parameters below describe the full-time equivalent number of students (FTES) each…
Q: percentage of humidity 0% 0% month average rainfall 21 mm January February March April May June 20…
A:
Q: IP A firm buys three types of equipments A, B and C on January 1, 1991. The purchase price and…
A: Given that -
Q: he following table is adapted from an article by Marshall Thomas in the F&W Forestry Letter. The…
A: We can estimate the price by using numerical methods(e.g. Divided difference Method).
Q: Using the data below, what is the 3 period moving average forecast for the 4th week? Week Time…
A: Given data is appropriate to forecast by using moving average . Moving average is a calculation to…
Q: Question : the commodity data are In Image . Determine (a) Laspeyer’s price index and Laspeyer’s…
A:
Q: An individual purchases three qualities of pencils. The relevant data is given below: Quality Price…
A:
Q: Fruit prices and the amounts consumed for 2010 and 2018 are shown. Use 2010 as the base. 2010 2018…
A: “Since you have posted a question with multiple sub-parts, we will solve the first three sub-parts…
Q: An individual purchases three qualities of pencils. The relevant data is given below: Quality Price…
A: Given that Quality Price per pencil ($) Money spent ($) A 1 50 B 1.5 30 C 2 20 Total…
Q: A typical high-income household in 1980 earned $133,684. A similar household in 2009 earned…
A: Given that Income in 1980 is $133,684 and income in 2009 is $193,529. Increased amount from 1980 to…
Q: Archaeologists can determine the diets of ancient civilizations by measuring the ratio of carbon-13…
A:
Q: students receiving scholarships. Students receiving scholarships Year Students 2017 18 2018 35 2019…
A:
Q: * 00 SI Find the percentile that corresponds to a specific data value x by using the following…
A:
Q: Which of the following are examples of quantitative data? i. The length of the skeleton is one and a…
A: Defination of continuous random variable Continuous Continuous data set is the data in values is…
Q: Suppose seafood price and quantity data for the years 2000 and 2009 follow. Use 2000 as the base…
A: Price Relative:
Q: Using the data in the table below, calculate the Incidence Proportion as a decimal for each of the…
A: Given: Week New cases of Foodborne illness Total Cases of Foodborne illness Number of people who…
Q: The following table is adapted from an article by Marshall Thomas in the F&W Forestry Letter. The…
A: *concept:- 1. Average. 2. Percentage.
Q: Diameter (cm) Area (cm?) 2 3 4 13 28 10 79 16 201 20 314 26. Describe the general trend of the data.
A: The scatter plot can be obtained using EXCEL software. Enter the values of Dimeter in column A and…
Q: Identify which level of measurement is represented by the following data: 1. Years covered in…
A: Interval data: It is a continuous variable that takes the numerical values within the range of…
Q: What percent of the FTES were from 528.5 to 1447.5? (Enter your answer as a whole number.) % How…
A: Answer:----. Date:----26/10/2021 Percent of the FTES were from 528.5 to 144.7…
Q: By using the average of the quantities of two years as weights, compute a price index. Commodity…
A:
Q: 5. The researcher recorded the grade percentage that each Grade 7 student got correct in the last…
A: 5. As the grade percentage of each grade 7 student can be divided under 0%-10%, 10%-20%... 90%-100%…
Q: 2021 in a Southeast Asian city: Item Expenditure weight 2019 Price 2020 Price 2021 Price Clothes 10%…
A: Explanation: a)
Q: Personal Bankruptcy in Japan Number of Filings (in thousands) Using the data from the table,…
A:
Q: Average demand for iPods in the Rome, Italy, Apple store is 800 units per month. The May monthly…
A: Given: average demand per month=800 unitsmonthly index=1.25sales of May (seasonally adjusted)=?
Q: Oil is leaking out of a tanker damaged at sea. The damage to the tanker is worsening as evidenced by…
A:
Q: Time Studied per Day Weekly Test Grade (min) (percent) y 60 77 70 79 80 81 90 83 100 85 1 of 5
A: We have given that, The data set are : X:- 60, 70, 80, 90, 100 Y:- 77, 79, 81, 83, 85 Then, We…
Q: What is the age adjusted rate for population A? Age. Standard Population. Adjusted…
A: The age group, Standard population and adjusted rate in population A are given. WE have to compute…
Q: The number N of locations of a popular coffeehouse chain is given in the table. (The numbers of…
A:
Q: The Forestry Club sells Christmas trees each year to raisemoney for club activities. The trees cost…
A: As per given table: No. of trees sold (x) Frequency (f) Probability fi∑xi Cumulative frequency…
Q: Question : the commodity data are In Image . Determine (a) Paasche’s price index and Paasche’s…
A: In this case, we need to find Paasche’s price index and Paasche’s quantity index.
Q: Streams As part of the course work, a class at an upstateNY college collects data on streams each…
A:
Q: The following are the P/E ratios (price of stock divided by projected earnings per share) for 18…
A: Calculate Percentiles-10 , Percentiles-75 from the following…
Q: The dollar values take into account the changes in the economy over the years (i.e., inflation).…
A: Given that ending quantity = 164923 and starting quantity = 136371
Q: Adjusted Gross Incomes. The Internal Revenue Service (IRS) publishes data on adjusted gross incomes…
A: (a) Looking at the histogram, on the horizontal axis, Adjusted gross incomes (in thousands) are…
Q: 103. U.S. Cigarette Consumption The following table lists the number of cigarettes in billions…
A: Formula: Average rate of change=[f(x2)-f(x1)]/(x2-x1)
Q: Item Expenditure (Rs.) Food 240 The adjoining table gives the break-up of Clothing 66 the…
A:
Q: The following table is adapted from an article by Marshall Thomas in the F&W Forestry Letter. The…
A: Since you have posted a question with multiple sub-parts, we will solve first three subparts for…
Q: Use Fisher 's form find the price index number of the following table: Commodity Unit Base Year…
A: Index numbers are statistical devices to measure the relative changes in the level of phenomenon…
Q: 1575 1650 1725 1800 1875 1950 2025 Distribution of Prices Wti the appraximate percentage of buyers…
A: Let X be the random variable from normal distribution with mean = 1800 and standard deviation= 75…
Q: Calculate relative frequency for the data below?
A: We have given that the frequency distribution table. The total frequency is 33.
Q: 1. The graph below shows the number of COVID 19 deaths in the Philippines from February 15, 2020 to…
A: It is given that, Number of deaths on April 1=96 Number of deaths on August 1=2039 It is known…

Step by step
Solved in 2 steps

- Assuming the lowest decile of men receive an average of $800/month in Social Security, while the highest decile receive $2200/month in Social Security how much does each receive (on average) during their years in retirement. Use the chart called: Predictive Years of Receiving Social Security Benefits. Also use the born in 1940 data.determine the seasonal pattern with the ratio to moving average methodThe Excel file (Forecasting Assignment Data) contains quarterly motorcycle shipments for Harley-Davidson from 2000 through 2006. Forecast Harley-Davidson quarterly motorcycle shipments for 2007 using winter's method
- use the previous data its the contueniousationThe toco toucan, the largest member of the toucan family, possesses the largest beak relative to body size of all birds. This exaggerated feature has received various interpretations, such as being a refined adaptation for feeding. However, the large surface area may also be an important mechanism for radiating heat (and hence cooling the bird) as outdoor temperature increases. Presented is the data for beak heat loss, as a percent of total body heat loss from all sources, at various temperatures in degrees Celsius. [Note: The numerical values in this problem have been modified for testing purposes.] Temperature (°C) 1515 1616 1717 1818 1919 2020 2121 2222 2323 2424 2525 2626 2727 2828 2929 3030 Percent heat loss from beak 3232 3636 3636 3333 3535 4747 5757 5151 4242 5353 4646 5252 5959 5959 6363 6262 (a) What is the equation of the least‑squares regression line for predicting beak heat loss, as a percent of total body heat loss from all sources, from temperature? (Use…Find out the birth weight in grams of a full term singleton baby if he/she is at the 80th percentile.
- the dataset shows the temperature change in middle east regions and west african region for 5 years analyze the similarities between both the regions using SPSSFor each description of data, identify theW’s, name the variables, specify for each variable whether itsuse indicates that it should be treated as categorical or quantitative, and, for any quantitative variable, identify the units inwhich it was measured (or note that they were not provided) Vineyards Business analysts hoping to provide information helpful to American grape growers compiled thesedata about vineyards: size (acres), number of years inexistence, state, varieties of grapes grown, average caseprice, gross sales, and percent profit.The toco toucan, the largest member of the toucan family, possesses the largest beak relative to body size of all birds. This exaggerated feature has received various interpretations, such as being a refined adaptation for feeding. However, the large surface area may also be an important mechanism for radiating heat (and hence cooling the bird) as outdoor temperature increases. Here are data for beak heat loss, as a percent of total body heat loss from all sources, at various temperatures in degrees Celsius. [Note: The numerical values in this problem have been modified for testing purposes.] Temperature (oC)(oC) 15 16 17 18 19 20 21 22 23 24 25 26 27 28 29 30 Percent heat loss from beak 34 32 33 29 38 46 58 50 46 53 44 51 57 58 59 58 The equation of the least-squares regression line for predicting beak heat loss, as a percent of total body heat loss from all sources, from temperature is: (Use decimal notation. Enter the values of the intercept and slope rounded to two…
- The toco toucan, the largest member of the toucan family, possesses the largest beak relative to body size of all birds. This exaggerated feature has received various interpretations, such as being a refined adaptation for feeding. However, the large surface area may also be an important mechanism for radiating heat (and hence cooling the bird) as outdoor temperature increases. Here are data for beak heat loss, as a percent of total body heat loss from all sources, at various temperatures in degrees Celsius. [Note: The numerical values in this problem have been modified for testing purposes.] Temperature (oC)(oC) 15 16 17 18 19 20 21 22 23 24 25 26 27 28 29 30 Percent heat loss from beak 33 32 33 32 39 43 56 48 44 49 44 56 58 60 60 63 The equation of the least-squares regression line for predicting beak heat loss, as a percent of total body heat loss from all sources, from temperature is: (Use decimal notation. Enter the values of the intercept and slope rounded to two…The toco toucan, the largest member of the toucan family, possesses the largest beak relative to body size of all birds. This exaggerated feature has received various interpretations, such as being a refined adaptation for feeding. However, the large surface area may also be an important mechanism for radiating heat (and hence cooling the bird) as outdoor temperature increases. Here are data for beak heat loss, as a percent of total body heat loss from all sources, at various temperatures in degrees Celsius. [Note: The numerical values in this problem have been modified for testing purposes.] Temperature (oC)(oC) 15 16 17 18 19 20 21 22 23 24 25 26 27 28 29 30 Percent heat loss from beak 33 33 34 31 37 46 54 49 41 50 44 56 55 61 64 59 The equation of the least-squares regression line for predicting beak heat loss, as a percent of total body heat loss from all sources, from temperature is: (Use decimal notation. Enter the values of the intercept and slope rounded to two decimal…

