Suppose seafood price and quantity data for the years 2000 and 2009 follow. Use 2000 as the base period. 2000 2000 2009 Seafood Qty. (Ib) Price ($/lb) Price ($/lb) Halibut 75,190 1.91 2.23 Lobster 83,280 3.52 3.09 Tuna 50,779 1.87 1.97 (a) Compute a price relative for each type of seafood. (Round your answers to one decimal place.) Seafood Price Relative Halibur
Suppose seafood price and quantity data for the years 2000 and 2009 follow. Use 2000 as the base period. 2000 2000 2009 Seafood Qty. (Ib) Price ($/lb) Price ($/lb) Halibut 75,190 1.91 2.23 Lobster 83,280 3.52 3.09 Tuna 50,779 1.87 1.97 (a) Compute a price relative for each type of seafood. (Round your answers to one decimal place.) Seafood Price Relative Halibur

Glencoe Algebra 1, Student Edition, 9780079039897, 0079039898, 2018
18th Edition
ISBN:9780079039897
Author:Carter
Publisher:Carter
Chapter10: Statistics
Section10.6: Summarizing Categorical Data
Problem 31PPS

Related questions
Question
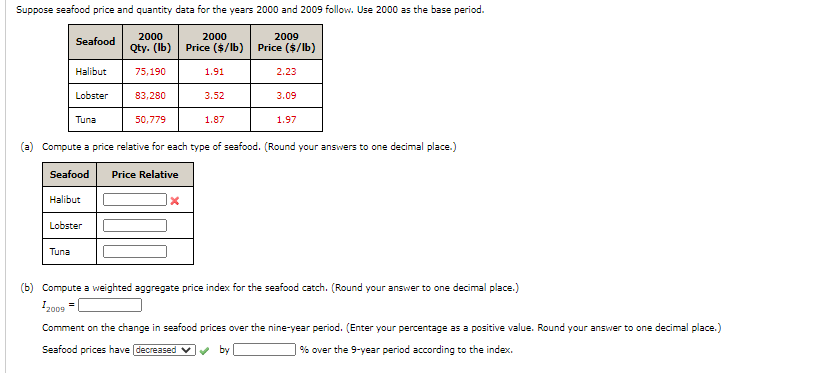
Transcribed Image Text:Suppose seafood price and quantity data for the years 2000 and 2009 follow. Use 2000 as the base period.
2000
2000
2009
Seafood
Qty. (Ib) Price ($/lb) Price ($/lb)
Halibut
75,190
1.91
2.23
Lobster
83,280
3.52
3.09
Tuna
50,779
1.87
1.97
(a) Compute a price relative for each type of seafood. (Round your answers to one decimal place.)
Seafood
Price Relative
Halibur
Expert Solution
This question has been solved!
Explore an expertly crafted, step-by-step solution for a thorough understanding of key concepts.

This is a popular solution!

Trending now
This is a popular solution!

Step by step
Solved in 3 steps with 2 images

Knowledge Booster


Learn more about
Need a deep-dive on the concept behind this application? Look no further. Learn more about this topic, statistics and related others by exploring similar questions and additional content below.Recommended textbooks for you
Glencoe Algebra 1, Student Edition, 9780079039897…
Algebra
ISBN:
9780079039897
Author:
Carter
Publisher:
McGraw Hill
Glencoe Algebra 1, Student Edition, 9780079039897…
Algebra
ISBN:
9780079039897
Author:
Carter
Publisher:
McGraw Hill