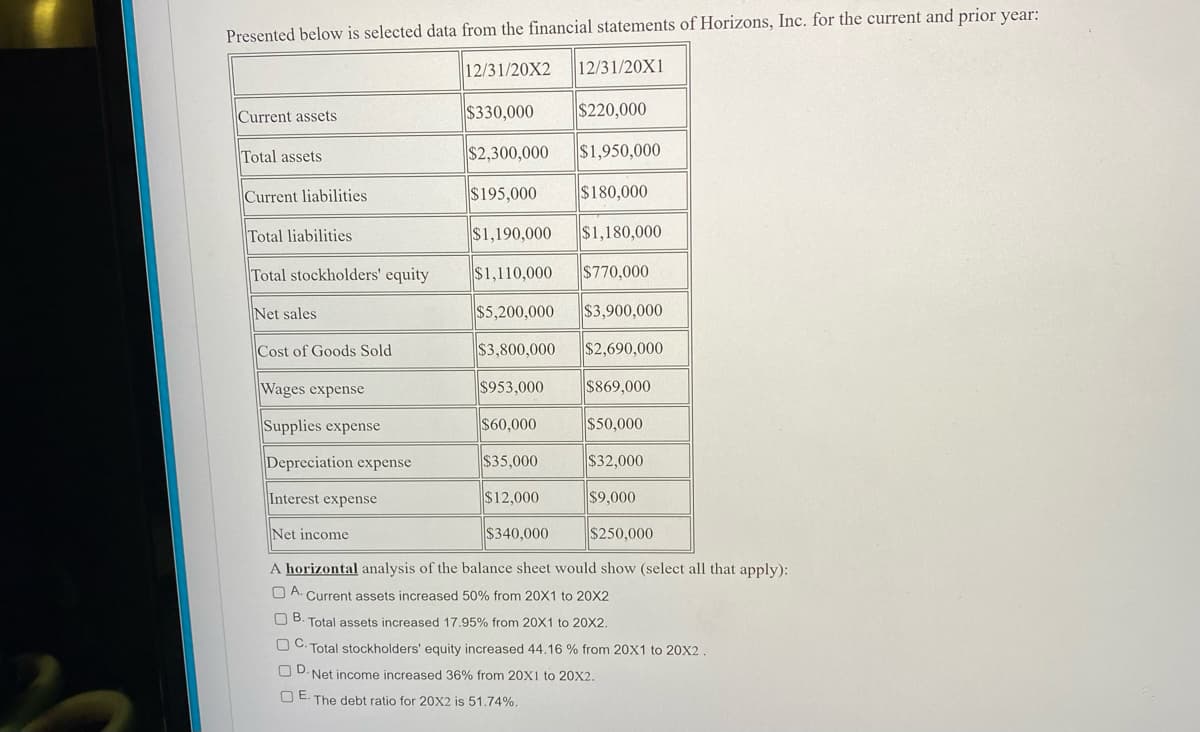
Presented below is selected data from the financial statements of Horizons, Inc. for the current and prior year: 12/31/20X2 12/31/20X1 Current assets $330,000 $220,000 Total assets $2,300,000 $1,950,000 Current liabilities $195,000 $180,000 Total liabilities $1,190,000 $1,180,000 Total stockholders' equity $1,110,000 $770,000 Net sales $5,200,000 $3,900,000 Cost of Goods Sold $3,800,000 $2,690,000 Wages expense $953,000 $869,000 Supplies expense $60,000 $50,000 Depreciation expense $35,000 $32,000 Interest expense $12,000 $9,000 Net income $340,000 $250,000 A horizontal analysis of the balance sheet would show (select all that apply): А. Current assets increased 50% from 20X1 to 20X2 В. Total assets increased 17.95% from 20X1 to 20X2. C. Total stockholders' equity increased 44.16 % from 20X1 to 20X2. D. Net income increased 36% from 20X1 to 20X2. O E. The debt ratio for 20X2 is 51.74%.


The Statement of Financial Position -
The statement of financial position is the position of the assets as on the balance sheet date.
If we have to evaluate the horizontal analysis of the financial position then we have to use the following formula -
Current Asset (Current Year - Base Year) / Base Year.
We will get change between the current year and base year also by dividing the base year we will get the % change from the base year in the current year.
The Statement of Comprehensive Income -
The statement of comprehensive income is the profit earned and loss incurred in the period end.
If we evaluate the financial analysis of the financial position then we have to use the following formula -
Sales (Current Year - Base Year) / Base Year.
We will get change between the current year and base year also by dividing the base year we will get the % change from the base year in the current year.

Trending now
This is a popular solution!

Step by step
Solved in 2 steps with 1 images


