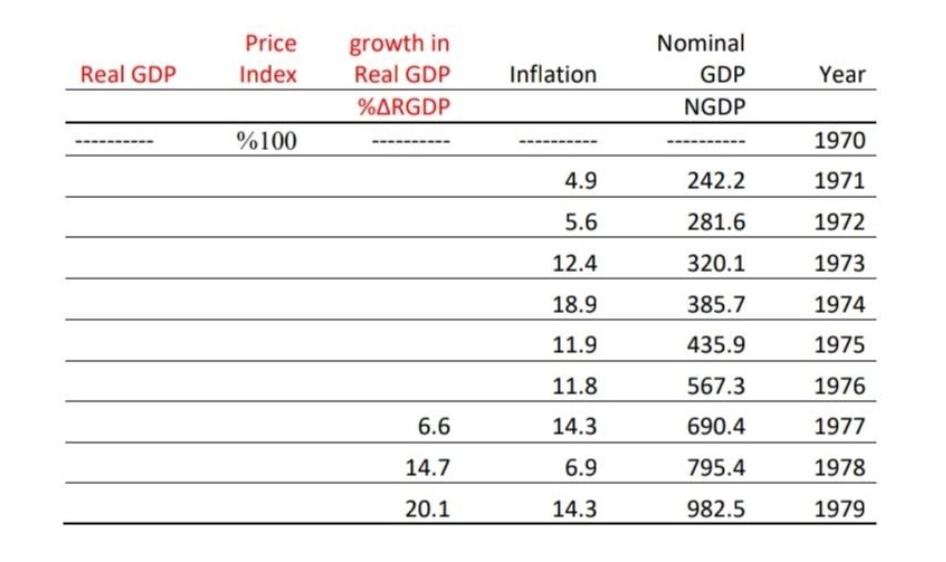
Price growth in Nominal Real GDP Index Real GDP Inflation GDP Year %ARGDP NGDP %100 1970 4.9 242.2 1971 5.6 281.6 1972 12.4 320.1 1973 18.9 385.7 1974 11.9 435.9 1975 11.8 567.3 1976 6.6 14.3 690.4 1977 14.7 6.9 795.4 1978 20.1 14.3 982.5 1979


Q: The relationship between inflation rate and growth rate of real GDP 50% 45% 40% 35% 30% 25% 20% 15%…
A: Inflation: It is the overall rise in the level of prices in the economy. In other words, it can be…
Q: Calculate the GDP deflator and the rate of inflation for each year: (€ million) 2013 2014 2015…
A: The GDP deflator monitors price changes across all goods and services produced in a nation.The GDP…
Q: Questions A.12 - A.20: Answer the following questions based on the data in the table for nominal…
A: Consumer price index CPI shows the cost of market basket of goods and services which is bought by a…
Q: Refer to the accompanying data, using year 1 as the base year. All dollars are in billions. Real GDP…
A: Real GDP refers to the value of all final goods and services produced in a time period, adjusted for…
Q: An analyst needs to adjust the nominal GDP for the years 2000 and 2010 into real terms to conclude…
A: Given: Nominal GDP in 2000= $672 billion Nominal GDP in 2010=$1,690 billion real interest rate in…
Q: 4. The percentage increase in the Retail Price Index (RPI) from year 2015 to year 2021 is 8.8%.…
A:
Q: "Consumer Price IndexGiven the following data, what was the value of the consumer price index in the…
A: The inflation rate, which describes how general prices fluctuate over the previous year, is…
Q: To measure the inflation rate, we calculate the percentage change ini. the consumer price indexii.…
A: The inflation rate can be calculated by measuring the percentage change in GDP deflator or the…
Q: GDP for 2010 in 2009's prices 3510 GDP for 2010 in 2010's prices $3924 Using 2009 as the base year,…
A:
Q: Quantitiy 4 2 2019 Price 1,5 1,5 4 Quantitiy 2020 Price 2,5 4 1 Quantitiy 4 2021 Price 3 1,5 2,5…
A: the GDP deflator is described as a measure of the level of prices of all new, domestically…
Q: Consider the data for a known country for the consumer price index (CPI), by components:(base year…
A: a) The value of the CPI index in December 2018 is 107.76. The value of the CPI index in the Base…
Q: Exercise 4.1 You have the following annual data for an economy: Consumer price index (2007=100) Year…
A: Since we only answer up to 3 sub-parts, we’ll answer the first 3. Please resubmit the question and…
Q: 2. The following is also known for Ekonland: 2019 2020 Q P Q Pen 180 3 220 Раper 1100 1 1500 Eraser…
A: Answer: (a). The formula to calculate nominal GDP is given below: Nominal GDP=Price in current…
Q: A country produces only sugar and wheat in the quantities and prices listed below. The GDP deflator…
A: GDP Deflator measure of the level of prices of all new, domestically produced, final goods and…
Q: Item 2017 2018 2019 Quantity Price Quantity Price Quantity Price…
A: 1) Real GDP in 2018 Real GDP is GDP at constant price. So, here we take 2017 prices as constant.…
Q: Consider the following table: The year 2015 Base Year Price Index = (120) Base Year…
A: A. Nominal GDP 2016 can be calculated as follows: Nominal GDP=5×140=700 million Real GDP can be…
Q: Year Real GDP Nominal GDP Price Index 2000 $14,500 A 100 2001 $15,500 $17,000 B 2002 S20,000 117…
A: The price index (GDP deflator ) is calculated as Price index = Nominal GDPReal GDP×100 We have to…
Q: Year Nominal GDP Price Index $ 3,166 100 2 3,402 104 3 3,774 108 4 3,989 112 Refer to the…
A: Answer: Let us use the following formula to find the real GDP: Price index=Nominal GDPReal…
Q: The following prices and quantities produced were recorded in computer land during the years shown…
A: GDP deflector=nominal GDPreal GDP×100
Q: Consider the table below. Year CPI CPI Inflation Real GDP Nominal GDP GDP Deflator GDP Inflation…
A: When talking about inflation rate, it is analyzed by comparing the current years price with the base…
Q: The following Table 2 gives the consumer price index from year 2012 to 2017. Table 2 Year CPI…
A: Year CPI (2005=100) CPI (2014=100) 2012 102.3 2013 110.5 99.8 2014 111.3 100.0 2015…
Q: 5. If nominal GDP was $11,500 billion in 2003 and the price level in 2003 was 111.6, then real GDP…
A: here we calculate the real GDP and choose the correct option below which are as follow-
Q: 2010 2015 Good Quantity Price Quantity Price Hot dogs 200 $2 250 $4 Hamburgers 200 $3 500 $4 A.…
A:
Q: In 2018, the nominal GDP = 24000 and real GDP = 19000 In 2019, the nominal GDP = 26000 and real GDP…
A: The inflation rate would result in the various components of the inflation namely GDP deflator and…
Q: efer to the data below: Nominal GDP (in Billions of Dollars) GDP Deflator (Price Index, 2012- 100)…
A: Formula for calculating Real GDP Real GDP = Nominal GDPGDP Deflator
Q: C) Between 2018 and 2021, GDP measured in current prices fell from RM96 billion toRM48 billion. Over…
A: Dear student, you have asked multiple questions in a single post. In such a case, I will be…
Q: Calculate both nominal and real GDP for 2017, 2018 and 2019. I Assume 2015 as base year.
A: here we calculate the nominal and real GDP which are as follow-
Q: Question 1: In an economy, there are only two goods (Cars and cycles) produced. The data for last…
A: Since you have asked multiple questions, we will solve the first question for you. If you want any…
Q: Consider the table below. CPI Year CPI Real GDP Nominal GDP GDP Deflator GDP Inflatio Inflation 2005…
A: CPI inflation in 2007 = 8.30 CPI of 2007 = a CPI of 2006 =100 -------------------- CPI inflation =…
Q: Chain-weighted Price Deflators (Index) for GDP 2012 = 100 (Base Year) Nominal GDP Year (in Billions)…
A:
Q: Suppose the Consumer Price Index in 2016 is 127.1 with 2002 as the base year a) What is the…
A: The purchasing power measures the change in the value of the dollar to the consumer of goods and…
Q: A country’s nominal GDP rose from 600B to 770B while its real GDP rose from 500B to 550B.…
A: Using the following formulae: GDP deflator = 100* Nominal GDP / Real GDP inflation rate = 100 *…
Q: 1.Based on the following statistic, form a price index (consider 2015 as the base year) for the…
A: "Since you have asked multiple questions, we will solve the first one for you. If you want any…
Q: The following Table 2 gives the consumer price index from year 2012 to 2017. Table 2 Year CPI…
A: Consumer price index is used for calculating inflation in the country. It shows the weighted average…
Q: i. Calculate Happyland Republic's nominal GDP, real GDP in 2020. Also, calculate the GDP deflator if…
A: Below is the calculated values in table:
Q: 2018 2019 2020 Nominal National 550 705 Product (RM billion) True National 440 495 Product (RM…
A: The formula is as follows, Consumer price index for 2018 = [Nominal national product / True national…
Q: Year 2010 2011 2012 2013 2014 2015 2016 2017 20 30 25 20 25 40 25 75 GNPN 200 450 300 300 1000 2000…
A: Gross national product is the value of all final goods and services produced by the national…
Q: Year 1 Year 2 Good Quantity Price Quantity Price Milk 500 $2 900 $3 Butter 2000 $1 3000 $2 Between…
A: A price index number is a macroeconomic measure that compares a series of prices in different time…
Q: Year Nominal GDP (in Billion Ringgit) GDP Deflator (Base Year 1987) 2005 495,239 189 2006 546, 343…
A: Answer to the question is as follows :
Q: Consider the table below Year Fruit Index Fruit Inflation Real GDP Nominal GDP GDP Deflator GDP…
A: Here, value of d provide information about the nominal GDP of the country in year 2006.
Q: a) Explain why fixed-weighted measures lead to substitution bias. b) Look at the following table.…
A: Hi. since there are multiple questions we will answer the first one.
Q: A consumer price index ( a measure of prices in the US ) had a value of 266.8 in April of 2021 and…
A: Inflation rate is calculated using the inflation rate formula: Subtract the past date CPI from the…
Q: Nominal GDP Real GDP Price Index Year (Billions) (Billions) (Year 0 = 100) %3D 1 15,064.4 101.4 2…
A: Nominal GDP is an appraisal of monetary creation in an economy however remembers the current prices…
Q: Use the information from the preceding table to fill in the following table. Year Nominal GDP Real…
A: Nominal GDP estimates the value of goods and services at prices prevailing in the current year. Real…
Q: Consider the following data for Canada: GDP deflator, 2016 (base year: 2010): 108.091 GDP deflator,…
A: Here we calculate the followings terms by using the given information and conclude the answer , so…
Q: The average price of milk per gallon was $1.85 in 1980 and $4.53 in 2017. The consumer price index…
A: "Consumer price index depicts an overall change in price levels over time on the basis of a…
Q: In Anasville nominal GDP in 2030 is $30,000 and the price index (base of 100 in 2020) stands at 150.…
A: Nominal GDP in 2030 is $30,000 the price index (base of 100 in 2020) stands at 150
Q: Price of a house $120,000 $145,000 Number of houses produced 1000…
A: Nominal GDP measures value of good and services using current price whereas real GDP uses constant…
Complete the table
1970 is the base year.


Trending now
This is a popular solution!

Step by step
Solved in 2 steps with 1 images


- Consider the following data on U.S. GDP: Year Nominal GDP GDP Deflator (Billions of dollars) (Base year 2009) 2016 18,707 105.93 1996 8,073 73.18 The growth rate of nominal GDP between 1996 and 2016 was , and the growth rate of the GDP deflator between 1996 and 2016 was . (Hint: The growth rate of a variable XX over an NN-year period is calculated as 100×((XfinalXinitial)(1N)−1)100×XfinalXinitial1N−1) Measured in 2009 prices, real GDP was billion in 1996 and billion in 2016. (Note: Select the answers closest to the values you compute.) The growth rate of real GDP between 1996 and 2016 was . The growth rate of nominal GDP between 1996 and 2016 was than the growth rate of real GDP.Consider the following data on the Pakistan economy:Nominal GDP GDP Deflator Year (in billions of rupees) (base year 2012)2018 21,501 111.4 1998 9,163 76.3 i. What was the growth rate of nominal GDP between 1998 and 2018? (Hint: The growth rate of a variable X over an N-year period is calculated as [(Xfinal/Xinitial)1/N – 1] x 100). ii. What was the growth rate of the GDP deflator between 1998 and 2018? iii. What was real GDP in 1998 measured in 2012 prices? iv. What was real GDP in 2018 measured in 2012 prices? v. What was the growth rate of real GDP between 1998 and 2018? vi. Was the growth rate of nominal GDP higher or lower than the growth rate of real GDP? Explain.Suppose nominal GDP is S99,000 and the GDP deflator is 110. Real GDP is: A $90,000 B $108,900 C $10,890,0 D $900
- If nominal GNP through expenditure approach is $10000 and real GNP is $10000. Find the GNP deflator.Year Waffles(Quantity) Waffles(Price) Orange Juice(Quantity) Orange Juice(Price) Toaster Ovens(Quantity) Toaster Ovens(Price) 2010 1000 $0.80 400 $4 280 $22 2011 1200 $0.90 410 $5 300 $25 2012 1500 $1 420 $6 300 $28 The above, like I said, is production data. Consumption data is as follows: the average citizen consumes 80 waffles, 20 units of orange juice and 10 toaster ovens. 2010 is the base year for all calculations. Carefully following all directions for entering your answer, tell me the cost (price) of the market basket for 2011. Carefully following all directions for entering your answer, calculate the inflation rate, using the CPI, for 2011-2012. Carefully following all directions for entering your answer, calculate the inflation rate, using the CPI, for 2011-2012. Carefully following all directions for entering your answer, calculate the GDP deflator for 2011 for this economy.Year Real GDP Nominal GDP 2019 $15,292.67 $17,081.38 2020 $17,822.90 $18,350.11 2021 $18,521.37 $19,397.19 Refer to the table above. What is the growth rate in real GDP from 2020 to 2021? Answer this as a percentage and round your answer to two digits after the decimal without the percentage sign. ex. If you found the rate to be 5.125%, answer 5.13.
- Explain/demonstrate period(s), since 2010, where the Jamaican economy experienced GDP Growth. Include at least one (1) economic development that would have contributed to each of the economic situations materializing. Gross Domestic Product at Constant Prices from 2010 to 2019 (Source: STATIN, adjusted for ECN201) Item 2010 2011 2012 2013 2014 2015 2016 2017 2018 2019 The Expenditure Method Gross Domestic Expenditure 942,350 980,689 963,486 965,214 966,311 953,543 953,901 973,620 987,322 1,001,400 Private Final Consumption Expenditure 644,269 668,907 662,325 657,777 652,211 651,549 650,520 658,147 664,654 671,455 Government Final Consumption Expenditure 125,095 123,275 123,494 120,046 119,514 119,336 120,911 121,768 121,482 123,616 Gross Fixed Capital Formation 170,404 184,289 175,160 185,032 190,625 181,443 181,576 190,001…Consider the following data on the Pakistan economy: Nominal GDP GDP Deflator Year (in billions of rupees) (base year 2012) 2018 21,501 111.4 1998 9,163 76.3 What was the growth rate of nominal GDP between 1998 and 2018? (Hint: The growth rate of a variable X over an N-year period is calculated as [(Xfinal/Xinitial)1/N – 1] x 100). What was the growth rate of the GDP deflator between 1998 and 2018? What was real GDP in 1998 measured in 2012 prices? What was real GDP in 2018 measured in 2012 prices? What was the growth rate of real GDP between 1998 and 2018? Was the growth rate of nominal GDP higher or lower than the growth rate of real GDP? Explain.A good predictor of future cash flows includes: Select one: a. net income in past year b. cash receipts and cash payments in the current year c. net income in current year. d. past cash receipts and past cash payments
- Given below is the total Disposable Personal Income in Oman from 2010–2018. Draw a time series graph to show the analysis.Year Income (in 000s)2010- 50002011- 30002012 75002013- 80002014- 85002015 95002016 100002017 105002018 11000In which year the income shows a downward trend from the graph. Select one:a. 2016b. 2018c. 2015d. 2011Write the equation for the Rate of Return?Suppose nominal GDP was $13,302.3 billion in 2007 and was $13,790.2 billion in 2009. If the GDP deflator for 2009 (with a base year of 2007) was 103.034, what is the growth rate of real output between 2007 and 2009? Show your calculations, otherwise you will lose a lot of points..


