Price level (GDP price index, 2012 = 100) AD2 AD, AD Real GDP (trillions of 2012 dollars) In the figure above, the shift in the aggregate demand curve from AD1 to AD2 could be result of O a. an increase in taxes. O b. a fall in the price level. an increase in government expenditures on goods and services. O d. a decrease in the quantity of money. O e. a rise in the price level.
Price level (GDP price index, 2012 = 100) AD2 AD, AD Real GDP (trillions of 2012 dollars) In the figure above, the shift in the aggregate demand curve from AD1 to AD2 could be result of O a. an increase in taxes. O b. a fall in the price level. an increase in government expenditures on goods and services. O d. a decrease in the quantity of money. O e. a rise in the price level.

Chapter11: Gross Domestic Product
Section: Chapter Questions
Problem 12SQ

Related questions
Question
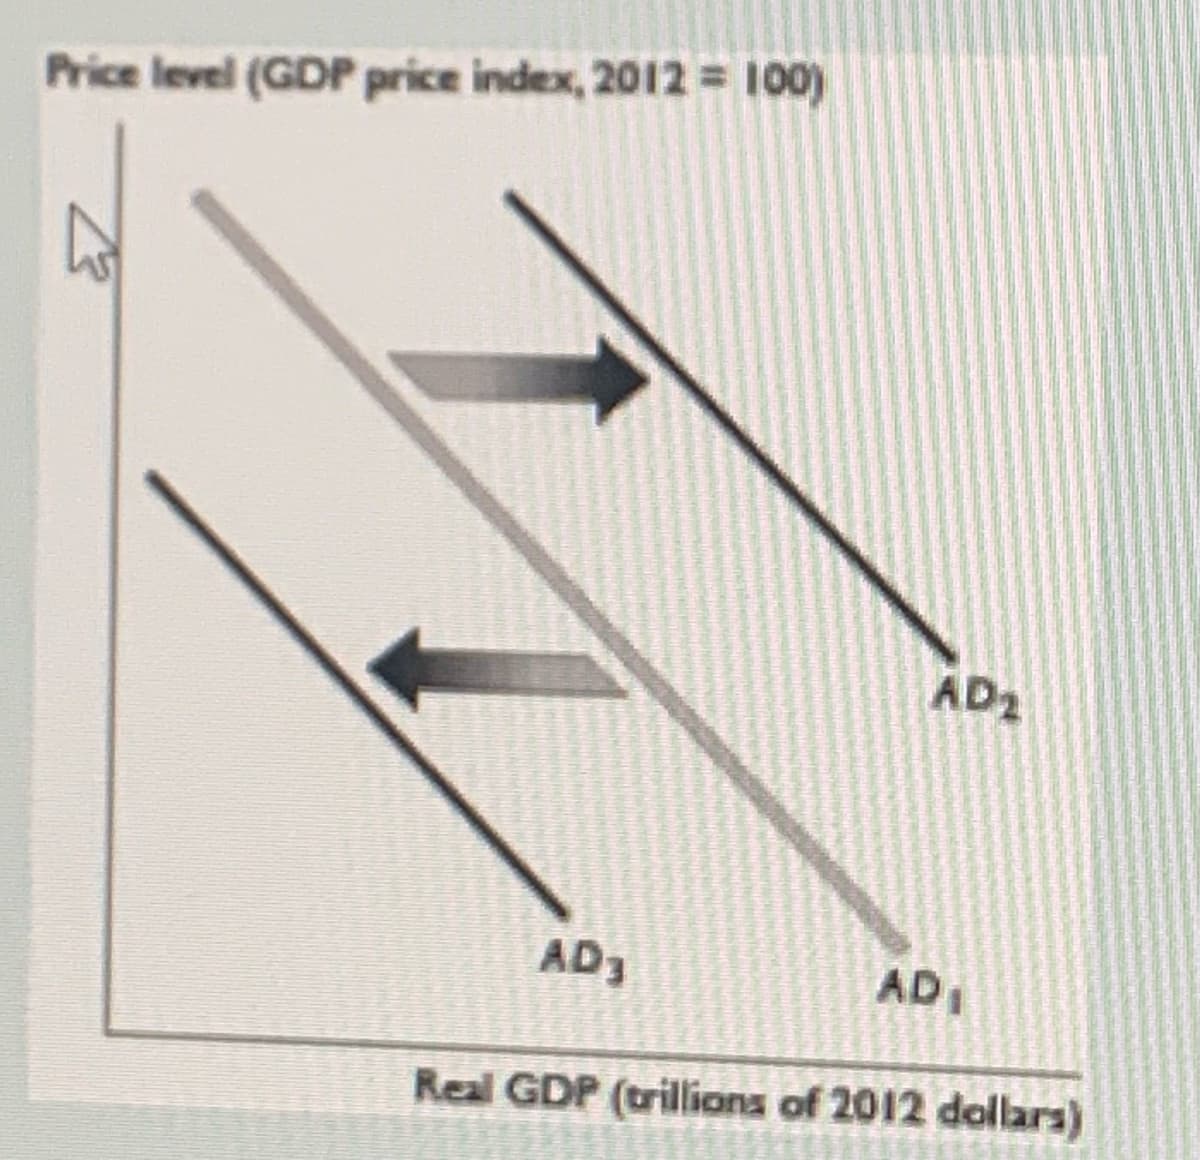
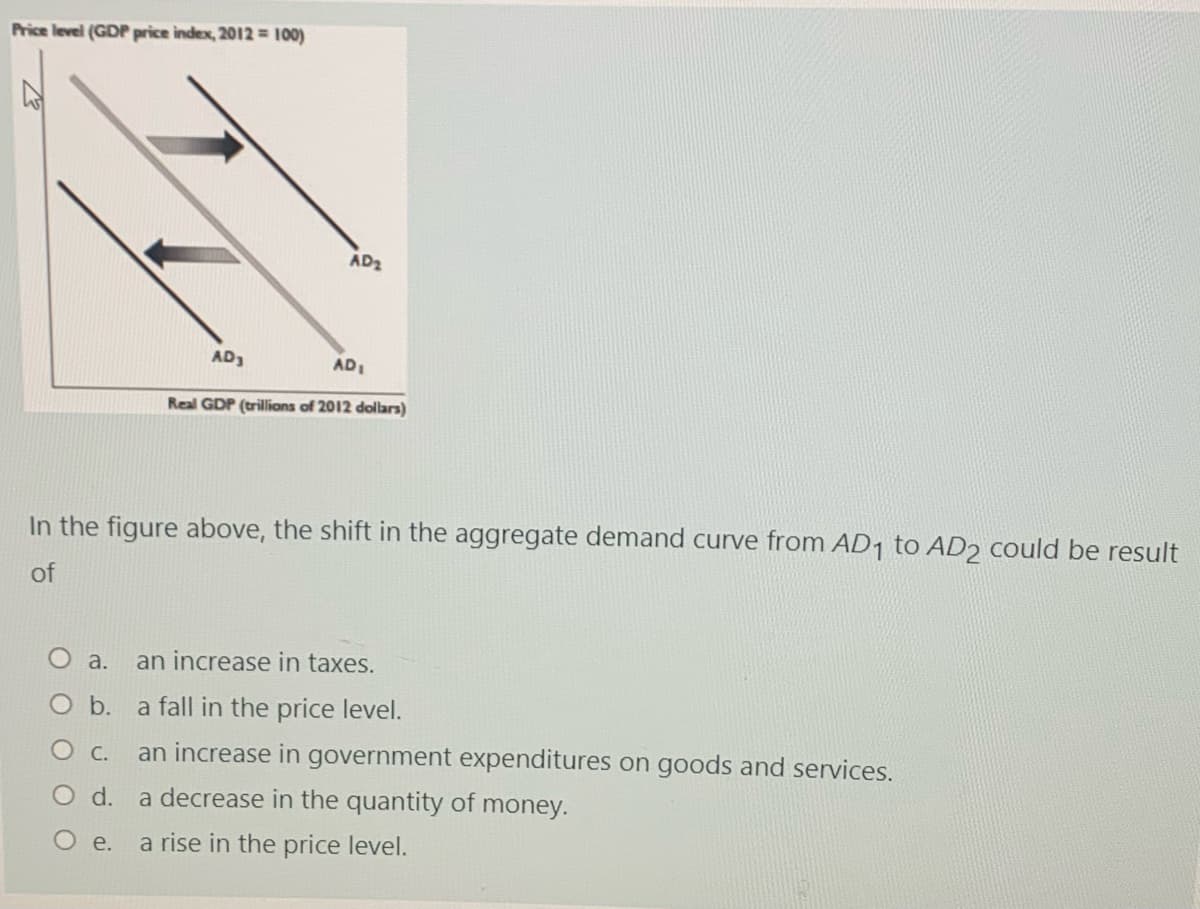
Transcribed Image Text:Price level (GDP price index, 2012 = 100)
AD2
AD3
AD
Real GDP (trillions of 2012 dollars)
Transcribed Image Text:Price level (GDP price index, 2012 = 100)
AD2
AD3
AD
Real GDP (trillions of 2012 dollars)
In the figure above, the shift in the aggregate demand curve from AD1 to AD2 could be result
of
O a.
an increase in taxes.
O b.
a fall in the price level.
C.
an increase in government expenditures on goods and services.
O d.
a decrease in the quantity of money.
O e.
a rise in the price level.
Expert Solution
This question has been solved!
Explore an expertly crafted, step-by-step solution for a thorough understanding of key concepts.

Step by step
Solved in 3 steps

Knowledge Booster


Learn more about
Need a deep-dive on the concept behind this application? Look no further. Learn more about this topic, economics and related others by exploring similar questions and additional content below.Recommended textbooks for you

