PRICE OF A DOLLAR (In pesos) 
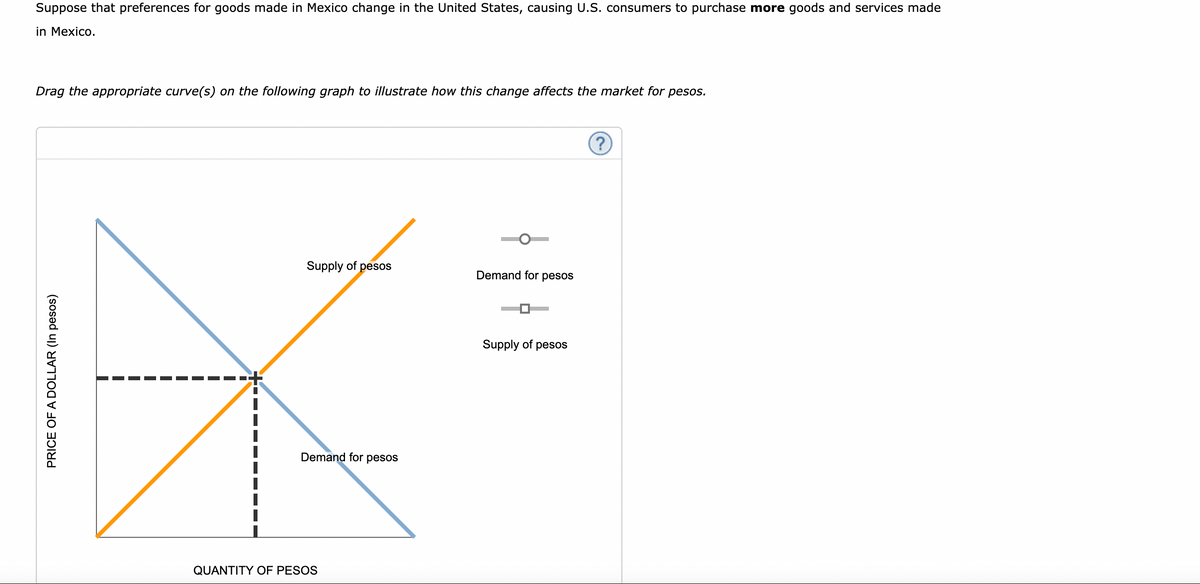
Suppose that preferences for goods made in Mexico change in the United States, causing U.S. consumers to purchase more goods and services made in Mexico. Drag the appropriate curve(s) on the following graph to illustrate how this change affects the market for pesos. QUANTITY OF PESOS Supply of pesos Demand for pesos Demand for pesos Supply of pesos ? A change in preferences that causes U.S. consumers to buy more Mexican-made goods and services will cause the U.S. dollar to relative to the peso.
Q: None
A: In any market, the interaction between demand and supply determines the equilibrium price and…
Q: In the 1960s, water was inexpensive. However, by 1965 Canada saw one of the country's worst…
A: The drought conditions in Canada during the 1965-66 period significantly impacted the water and…
Q: Real GDP per capita is 49,773 (measured in constant 2017 International Dollar, same for the…
A: The objective of the question is to decompose the differences in real GDP per capita between Canada…
Q: consider a domestic monopoly in a small country that produces a good with the following inverse…
A: QUESTION AFirst, we need to find the equilibrium quantity by setting the quantity demanded equal to…
Q: The wow expert Hand written solution is not allowed. Give proper explanation of the answers…
A: Justification for the Answers:a. Overnight Interest Rate:The overnight interest rate is the interest…
Q: Using the table below, calculate the indicated values. Sector Consumption Investment Government…
A: Givena) Gross domestic product is calculated as ;= Consumption+ investment+ goverment spending+ net…
Q: Table 1 Descriptive statistics and a summary of zero-order correlations and regression values for…
A: Based on Table 1 in Jonason et al. (2013), the dark traits that were not significantly associated…
Q: 7. Short-run supply and long-run equilibrium Consider the competitive market for rhenium. Assume…
A: Detailed explanation: Based on the graph, if there were 30 firms in the market, the short-run…
Q: imagine that the market supply of peaches comes from Georgia (GA) and South Carolina (SC). The table…
A:
Q: A foreign firm sells smartphones to a home country. The demand for smartphones in the home country…
A: A) Equilibrium price and quantity in the foreign market:The demand curve is given by Qd = 100 - 2P…
Q: All parts s answer needed
A:
Q: Aaron Platter Well, that's the strange thing. I've got total GDP at $7,200, as I said, and…
A: Understanding GDP:GDP (Gross Domestic Product) represents the total value of final goods and…
Q: 6. Problems and Applications Q11 Manuel, Shen, and Antonio run the only saloon in town. • Manuel…
A: i hope you got the concept. if you feel like having any doubt in any part of the question then feel…
Q: 1. Consider a Cournot duopoly with the inverse demand P = 260 - 2Q. Two firms compete choosing their…
A: Question: Consider a Cournot duopoly with the inverse demand P = 260-2Q. Two firms compete choosing…
Q: Use the Quantity Theory of Money equation to solve the following: If the velocity of circulation is…
A:
Q: What is the primary role of a central bank in a country's banking system? a) Issuing credit cards b)…
A: Central banks play a crucial role in overseeing the banking system, ensuring compliance with…
Q: None
A: To find the quantity of money supplied for the money market equilibrium, we can use the equation of…
Q: What does it mean in a monopolistically competitive market, when the rule for maximizing profit is…
A: The question is asking about the rule for maximizing profit in a monopolistically competitive…
Q: The protection of national industries is a multifaceted issue. For example, in response to the…
A: The question of whether trade barriers are beneficial or detrimental to a society is indeed complex…
Q: Year 2016 Price of Hot Dogs Price of Hamburgers $1 $2 2 3 2017 2018 Calculate the inflation rate…
A: The objective of the question is to calculate the inflation rate from 2017 to 2018 based on the…
Q: Marginal Price Quantity Sold Revenue Cost Marginal Average Total Cost $10 14 $10 15 (A) $8 $14 $10…
A: If the firm decides to produce 15 units ,the total revenue will be 15x10=150 the total cost of…
Q: Figure HW12-1 represents the market demand and supply of paper that is produced by a paper mill. The…
A: Detailed explanation:When the governmen regulates the paper mill to reduce it's chemical waste then…
Q: The marginal utility for shoes and coffee is given below for five individuals. A pair of shoes costs…
A: Optimizing over choices means making the best possible decision based on the available options and…
Q: Problem 11.017 Economic Service Life A piece of equipment has a first cost of $180,000, a maximum…
A: The economic service life is the number of years that it will take for the annual worth (AW) of…
Q: a)How do you calculate the correct social discount rate for each year, for user benefits in excel…
A: Sure, I'll illustrate a simpler, step-by-step example using a constant social discount rate of 4%…
Q: Describe the Phillips curve (O.G., not modified/expectations) and draw a graph of the relationship.…
A: In macroeconomics, the Phillips curve is a historical concept that describes the inverse…
Q: 5 Question Let Ya,n be the present value of an n-year term continuous annuity of $1 per year for an…
A: The objective of the question is to derive the covariance between the present value of an n-year…
Q: Since you know all about perfect competition, monopoly, and oligopoly, we can find out how various…
A: An oligopoly is a market structure characterized by a small number of dominant sellers who control a…
Q: A. Illustrate and label graph of imperfect competition in movie theatre with detailed explanation B.…
A:
Q: + Real GDP (Billion of 2000 dollars) Year 2002 $8,700 2003 8,875 2004 9,000 2005 9,280 6. Refer to…
A: The objective of the question is to calculate the growth rate of real GDP from 2004 to 2005 and the…
Q: A firm's total variable cost increases from $4,000 to $4,020 as the firm increases its output from…
A: To find the marginal cost of producing the 401st unit, we use the formula:Marginal Cost (MC) =…
Q: Oil Recovery A U.S. state's Bureau of Economic Geology published a study on the economic impact of…
A: Solve using linear regression equation ŷ = a + bxwhereb = N∑X2−(∑X)2N∑XY−∑X∑Ya = N∑Y−b(∑X) In…
Q: Bare Trees United issued 13-year bonds at a coupon rate of 8.5 percent. The bonds make semiannual…
A:
Q: $80 $75 MB $70 MC $65 $60 $55 $50 $45 $40 $35 $30 $25 $20 $15 $10 $5 $0 0 1 2 3 4 5 6 7 8 9 10 Hours
A: With the rent increase, Kaitlin and Tom would likely operate the shop for fewer than 4 additional…
Q: Please use the formulae and make the solution Project Month Month Month Month Status at the end of…
A: In order to find a solution to the issue, we will make use of the information that has been supplied…
Q: Within a monopolistically competitive industry, it would be expected that Group of answer choices…
A: The objective of the question is to understand the expected behavior of firms in a monopolistically…
Q: PRICE LEVEL INTEREST RATE (Percent) 4.0 5. Changes in the money supply The following graph…
A:
Q: A negative value for the line item "Changes in official international reserves" in the balance of…
A: The objective of the question is to understand what a negative value for the line item 'Changes in…
Q: Consider Nowehereland, a small open economy. Suppose business people in Nowhereland are pessimistic…
A: The question is asking about the impact of a decrease in demand for funds by businesses in a small…
Q: Based on the charts consulted, comment what is expected from the American economy in the next years…
A: 1. Do the results of the forecasts differ from one another?There are some discrepancies amongst the…
Q: Price ($) E P3 P₂ 11 11 Π n+ MC of ATC MR3 AVC MR₂ -MR₁ Quantity Question 4: Identify the profit or…
A:
Q: Give proper explanation and solve all parts will definitely upvote. Hand written solution is not…
A: Answer 13:-The best answer is:C) The error tends to be positive when inflation is relatively high…
Q: Based on the pictures of the graphs consulted, comment what is expected from the American economy in…
A: Detailed explanation: I can make the following conclusions about how the US economy is anticipated…
Q: Vacations-R-Us.com, the online cruise seller, wants to increase its total revenue. One strategy is…
A: a) Using midpoint method, % Change in quantity = (New quantity - Old quantity) / [(New quantity +…
Q: The following graph represents the demand and supply for blinkies (an imaginary product). The black…
A: Consumer Surplus is the area below the demand curve and above the price. Blank 4 : Hence, before…
Q: 3. (Infinitely Repeated Game). Two banks are competing for loans from clients. They compete through…
A: The Prisoner's Dilemma That Is Repeated IndefinitelyA Prisoner's Dilemma situation that can be…
Q: 14.3 Air Links, a commuter airline company, is considering replacing one of its baggage handling…
A: Let's examine in more depth how to determine the cash flows' present worth (PW) and arrive at a…
Q: Which of the following is an example of a macroeconomic indicator? A) The price of a specific…
A: Macroeconomic indicators are statistics that provide information about the overall state of the…
Q: Suppose that the supply of credit cards is given by (1/201) X = q, the nominal interest rate is…
A: Detailed Explanation:To find the quantity of money supplied for the money market to be in…
Q: Please give exact answer with explanation steps and take like
A: Step 1:The reserve requirement is the fraction of deposits that a bank must hold in reserve and lend…
view pictures
Trending now
This is a popular solution!
Step by step
Solved in 2 steps
- Suppose that the consumption basket consists of gasoline, mugs, and movies. In the base month, consumers buy 20 litres of gasoline at $2 per litre, 2 mugs for $13 each, and 4 movie tickets for $7 each. In the next month, the price of gasoline is $2.25 per litre, mugs cost $12.50 each, and the price of a movie ticket is $7.50. The change in the consumer price level from the first to the second month is ______. a. –6%b. 6.4%c. 94%d. 1.1%Q19 Suppose a consumer can purchase only two goods: pasta and rice. Let the quantity of pasta be measured on the vertical axis and the quantity of rice be measured on the horizontal axis. If the price of pasta falls, with no change in the price of rice or in the consumer's money income, then the budget line for the consumer will rotate... a. Outward parallel to the existing budget line. b. Toward the origin and become flatter. c. Away from the origin and become steeper. d. Away from the origin and become flatter. e. Toward the origin and become steeper.A short article in the January 10, 2011 edition of The New York Times discussed the amount spent on DVDs over the past six years: (In 2004) consumers spent about $21.8billion to rent and and buy DVDs, Blu-ray discs, digital downloads and other forms of home entertainment...The number has fallen every year since, for a total drop of about 13.8 percent, to $18.8 billion in 2010. The reporter noted that the actual drop was about double what it seemed to be when the figures were adjusted for inflation: $21.8 billion figure from 2004 would amount to $25.3billion in current dollars. The article also noted that box office revenues rose from $9.3billion in 2004 to $10.6 billion in 2010. Calculate the percentage increase in box office revenues, then re-calculate the percentage increase using inflation-adjusted dollars. Have box office revenues increased or decreased over this six-year time period?
- B5. I. Suppose a typical Australian household purchases three goods, creatively named good A, good B, good C. The prices of these goods includes, a. If the typical household purchases two units of each good, what was the percentage increase in the price paid by the household for this basket among 2011 and 2012. b. If the typical household purchases 10 units of good B and 2 units of both good A and good C, what was the percentage increase in the price paid by the household for this basket. c. Given answers to a and b, what is the relationship between the market basket and the percentage price change.Analysts say that the increase in gasoline prices comes a drop in SUV sales and trade-in values at dealerships.The U.S. Department of energy said that during the past week, U.S. gasoline topped $3 a gallon - the highest level since October 2008. According to Alec Gutierrez,lead analyst for vehicle evaluation at Kelley Blue Book, SUV sales have decreased about 1 percent since the last major gasoline price hike in spring 2008. He doesn't believe that SUV sales will decrease significantly unless prices reach $3.50 to $4 per gallon. if a gasoline price hike of 5 percent caused the SUV sales drop described, what is the cross-price elasticity of demand between gasoline and SUVs?The residents of Vegopia spend all of their income on cauliflower, broccoli, and carrots. In 2020, they spend a total of $210 for 100 heads of cauliflower, $70 for 50 bunches of broccoli, and $45 for 450 carrots. In 2021, they spend a total of $225 for 90 heads of cauliflower, $112 for 80 bunches of broccoli, and $120 for 400 carrots. Complete the following table by calculating the price of one unit of each vegetable in each year. Year Cauliflower Broccoli Carrots 2020 2021 Using 2020 as the base year, the CPI for 2020 is________ , and the CPI for 2021 is________ . The inflation rate in 2021 is _________ using the CPI.
- Suppose that people consume only three goods, as shown in this table: Tennis Balls Golf Balls Bottles of Gatorade 2020 price Rs.250 Rs.450 Rs.150 2020 quantity 100 100 200 2021 price Rs.250 Rs.653 Rs.255 2021 quantity 100 100 200 a. What is the percentage change in the price of Tennis Balls? b. What is the percentage change in the price of Golf Balls? c. What is the percentage change in the price of Bottles of Gatorade ? d. Using a method similar to the CPI, compute the percentage change in the overall price level.In terms of our shift variables of demand and supply, how are each of the following pairs related? Use the demand and supply diagram to identify the effects of an increase in the price of the first good on the equilibrium price and quantity exchanged of the second good. d. crackers and peanut butter e. cotton and dress shirtsf. neckties and dress shirtsTrue or False: Line B has a slope of infinity. (look at line labelled b) The following graphs show the relationship between the price of apples and the quantity of apples supplied in two different regions, the North and the and South. Assume that the two lines are parallel. In the North, if the price goes up by $0.20 per pound, then the quantity supplied in the North goes up by 100 pounds per year. If the price of apples goes up by $0.20 in the South, what will happen to the quantity supplied? A. The quantity will decrease by 100 pounds per year. B. There is not enough information given to determine the supply change in the South. C. The quantity will increase by 100 pounds per year. D. The quantity will increase by 50 pounds per year.
- In terms of our shift variables of demand and supply, how are each of the following pairs related? Use the demand and supply diagram to identify the effects of an increase in the price of the first good on the equilibrium price and quantity exchanged of the second good. a wheat and breadb. butter and breadc. peanuts and peanut butterConsider the following data on Prices and Quantities of orangesand VCRs. From a. – k Calculate the total value of goods and services at current prices in thiseconomy in 1998.b. Calculate the total value of goods and services at current prices in thiseconomy in 1999. using the imageIn problem 5, suppose that a flood destroys several potato farms and as a result supply decreases by 20 million bags a week at the same time as the new snack food comes onto the market. What is the new equilibrium price and quantity of chips? The table shows data from the United Kingdom in 2005. Item Billions of pounds Wages paid to labor 685 Consumption expenditure 791 Taxes 394 Transfer payments 267 Profits 273 Investment 209 Government expenditure 267 Exports 322 Saving 38 Imports 366 7. Calculate GDP in the United Kingdom. The transactions in Jupiter last year are in the table to the right. Calculate Jupiter’s aggregate expenditure. Calculate Jupiter’s net exports. Calculate Jupiter’s government expenditure.