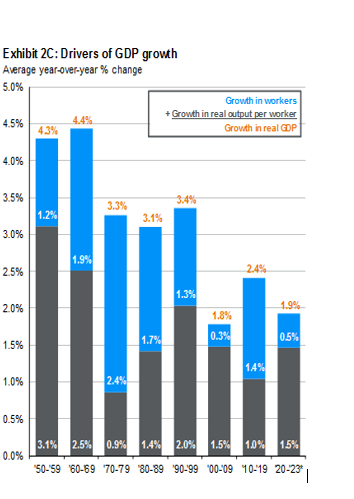
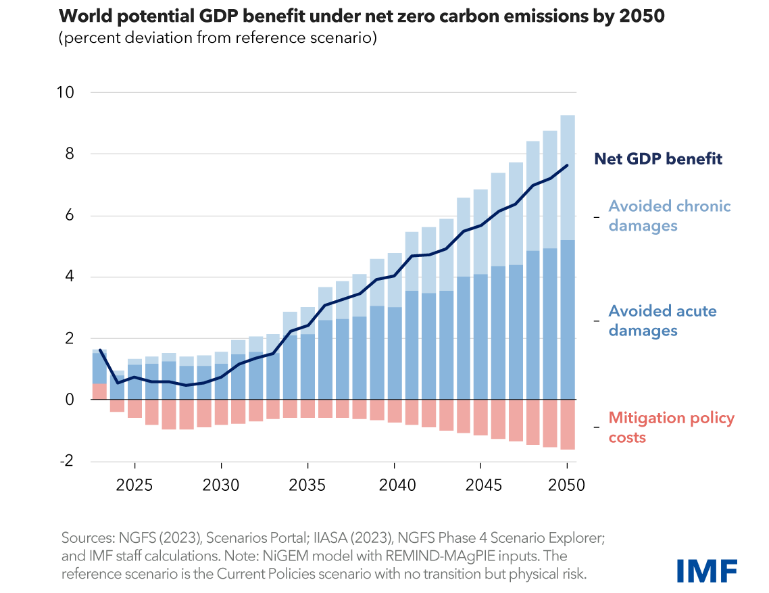
Exhibit 2C: Drivers of GDP growth Average year-over-year % change 5.0% 4.4% 4.5% 4.3% 4.0% Growth in workers + Growth in real output per worker 3.5% 3.4% 3.3% 1.2% 3.1% 3.0% 1.9% 2.5% 2.0% 1.5% 1.0% 2.4% Growth in real GDP 2.4% 1.3% 1.9% 1.8% 0.3% 1.7% 0.5% 14% 0.5% 0.0% 3.1% 2.5% 0.9% 1.4% 2.0% 1.5% 1.0% 1.5% '50-'59 60-69 70-79 80-89 90-99 '00-09 10-19 20-23° World potential GDP benefit under net zero carbon emissions by 2050 (percent deviation from reference scenario) 10 8 6 4 2 0 -2 2025 2030 2035 2040 2045 2050 Net GDP benefit Avoided chronic damages Sources: NGFS (2023), Scenarios Portal; IIASA (2023), NGFS Phase 4 Scenario Explorer; and IMF staff calculations. Note: NIGEM model with REMIND-MAGPIE inputs. The reference scenario is the Current Policies scenario with no transition but physical risk. Avoided acute damages Mitigation policy costs IMF
Exhibit 2C: Drivers of GDP growth Average year-over-year % change 5.0% 4.4% 4.5% 4.3% 4.0% Growth in workers + Growth in real output per worker 3.5% 3.4% 3.3% 1.2% 3.1% 3.0% 1.9% 2.5% 2.0% 1.5% 1.0% 2.4% Growth in real GDP 2.4% 1.3% 1.9% 1.8% 0.3% 1.7% 0.5% 14% 0.5% 0.0% 3.1% 2.5% 0.9% 1.4% 2.0% 1.5% 1.0% 1.5% '50-'59 60-69 70-79 80-89 90-99 '00-09 10-19 20-23° World potential GDP benefit under net zero carbon emissions by 2050 (percent deviation from reference scenario) 10 8 6 4 2 0 -2 2025 2030 2035 2040 2045 2050 Net GDP benefit Avoided chronic damages Sources: NGFS (2023), Scenarios Portal; IIASA (2023), NGFS Phase 4 Scenario Explorer; and IMF staff calculations. Note: NIGEM model with REMIND-MAGPIE inputs. The reference scenario is the Current Policies scenario with no transition but physical risk. Avoided acute damages Mitigation policy costs IMF
Chapter32: The Land Market And Natural Resources
Section: Chapter Questions
Problem 10E
Related questions
Question
- Based on the pictures of the graphs consulted, comment what is expected from the American economy in the next years in general terms.
- Are there differences in the
forecasts ? - How do you think the state will act in the future based on the chart variables that inform us about its behavior?
- What will the behavior of families and companies be like?
- Write in an essay form after all the questions have been answered.
Using these graphs provided, Answer the questions in an essay format, comparing the two.

Transcribed Image Text:Exhibit 2C: Drivers of GDP growth
Average year-over-year % change
5.0%
4.4%
4.5%
4.3%
4.0%
Growth in workers
+ Growth in real output per worker
3.5%
3.4%
3.3%
1.2%
3.1%
3.0%
1.9%
2.5%
2.0%
1.5%
1.0%
2.4%
Growth in real GDP
2.4%
1.3%
1.9%
1.8%
0.3%
1.7%
0.5%
14%
0.5%
0.0%
3.1% 2.5% 0.9% 1.4% 2.0% 1.5% 1.0% 1.5%
'50-'59 60-69 70-79 80-89 90-99 '00-09 10-19 20-23°

Transcribed Image Text:World potential GDP benefit under net zero carbon emissions by 2050
(percent deviation from reference scenario)
10
8
6
4
2
0
-2
2025
2030
2035
2040
2045
2050
Net GDP benefit
Avoided chronic
damages
Sources: NGFS (2023), Scenarios Portal; IIASA (2023), NGFS Phase 4 Scenario Explorer;
and IMF staff calculations. Note: NIGEM model with REMIND-MAGPIE inputs. The
reference scenario is the Current Policies scenario with no transition but physical risk.
Avoided acute
damages
Mitigation policy
costs
IMF
Expert Solution
This question has been solved!
Explore an expertly crafted, step-by-step solution for a thorough understanding of key concepts.
Step by step
Solved in 2 steps

Recommended textbooks for you

