Price per Good Quantity of Price per Good Quantity of Price per Good Quantity of Good Z Year Good X Good Y 2018 S10 10 $5 10 $10 20 2019 $10 14 $5.2 11 $10 21 2020 14 $5.4 12 s10 23 a. Using the provided information, fill in the following table. Year Nominal GDP 2018 2019 2020 b. b. What is the percentage change in nominal GDP from 2018 to 2019? Provide any formulas you use and show your work in calculating this answer. c. What was the percentage change in nominal GDP from 20 19 to 2020? d. Using 2018 as the base year, fill in the following table. Year Real GDP 2018 2019 2020
Price per Good Quantity of Price per Good Quantity of Price per Good Quantity of Good Z Year Good X Good Y 2018 S10 10 $5 10 $10 20 2019 $10 14 $5.2 11 $10 21 2020 14 $5.4 12 s10 23 a. Using the provided information, fill in the following table. Year Nominal GDP 2018 2019 2020 b. b. What is the percentage change in nominal GDP from 2018 to 2019? Provide any formulas you use and show your work in calculating this answer. c. What was the percentage change in nominal GDP from 20 19 to 2020? d. Using 2018 as the base year, fill in the following table. Year Real GDP 2018 2019 2020

Essentials of Economics (MindTap Course List)
8th Edition
ISBN:9781337091992
Author:N. Gregory Mankiw
Publisher:N. Gregory Mankiw
Chapter3: Interdependence And The Gains From Trade
Section: Chapter Questions
Problem 8PA

Related questions
Question
Can you solve the Option D please and fill the table in D please also Explain briefly please
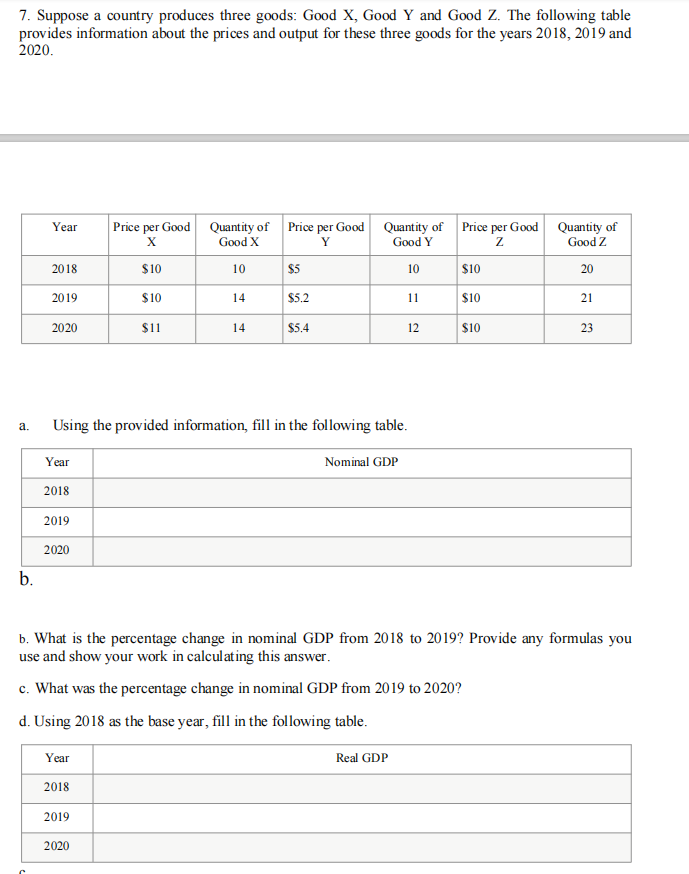
Transcribed Image Text:7. Suppose a country produces three goods: Good X, Good Y and Good Z. The following table
provides information about the prices and output for these three goods for the years 2018, 2019 and
2020.
Price per Good Quantity of Price per Good Quantity of Price per Good Quantity of
Good Z
Year
Good X
Y
Good Y
2018
$10
10
$5
10
$10
20
2019
$10
14
$5.2
11
$10
21
2020
$1
14
$5.4
12
$10
23
Using the provided information, fill in the following table.
а.
Year
Nominal GDP
2018
2019
2020
b.
b. What is the percentage change in nominal GDP from 2018 to 2019? Provide any formulas you
use and show your work in calculating this answer.
c. What was the percentage change in nominal GDP from 2019 to 2020?
d. Using 2018 as the base year, fill in the following table.
Year
Real GDP
2018
2019
2020
Expert Solution
This question has been solved!
Explore an expertly crafted, step-by-step solution for a thorough understanding of key concepts.

Step by step
Solved in 2 steps

Knowledge Booster


Learn more about
Need a deep-dive on the concept behind this application? Look no further. Learn more about this topic, economics and related others by exploring similar questions and additional content below.Recommended textbooks for you
Essentials of Economics (MindTap Course List)
Economics
ISBN:
9781337091992
Author:
N. Gregory Mankiw
Publisher:
Cengage Learning

Brief Principles of Macroeconomics (MindTap Cours…
Economics
ISBN:
9781337091985
Author:
N. Gregory Mankiw
Publisher:
Cengage Learning

Principles of Economics, 7th Edition (MindTap Cou…
Economics
ISBN:
9781285165875
Author:
N. Gregory Mankiw
Publisher:
Cengage Learning
Essentials of Economics (MindTap Course List)
Economics
ISBN:
9781337091992
Author:
N. Gregory Mankiw
Publisher:
Cengage Learning
Brief Principles of Macroeconomics (MindTap Cours…
Economics
ISBN:
9781337091985
Author:
N. Gregory Mankiw
Publisher:
Cengage Learning
Principles of Economics, 7th Edition (MindTap Cou…
Economics
ISBN:
9781285165875
Author:
N. Gregory Mankiw
Publisher:
Cengage Learning

Principles of Microeconomics
Economics
ISBN:
9781305156050
Author:
N. Gregory Mankiw
Publisher:
Cengage Learning

Principles of Economics 2e
Economics
ISBN:
9781947172364
Author:
Steven A. Greenlaw; David Shapiro
Publisher:
OpenStax