prices and/or wages fully reflect the benefits 8 eling up why not? 2. Oxana is conducting research on the demand for cleaner air in Novosibersk Sh notices that the Ministry of Housing built many identical dwellings around the city Why or V 20OLCIMOO :S Problems 175 CbkICE WE approximately the same distance from the center. The only difference is the average level of air pollution. She notes the following rental prices and air pollution levels for these dwellings:Mard bord lfa dbotgedtan ttst S 21 lzab IS1G Pollution level (ug/m3) totheilog de Rent (R/month) red Brw nobollog sd) 30 497 frq dns: orbac 1ithster tr 50 492 2.80T8L B bos s0ovi 4 2 dob 70 485 (12:97 2010 1a2ur e1 e159u0 ebip 475 455 90 199 to 0fm 709 8010 boulbisd or tof 120 10 150 430 200 375 bumgye me d:20 120126fX 0 250 305 300 219 Mioibcoe Plot the relationship between pollution levels (on the horizontal axis) and rent (on the vertical axis). On a separate graph, plot the relationship between pollution levels (on the horizontal axis) and the marginal valuation of pollution implicit in the relation- ship between rents and pollution levels (on the vertical axis). T0
prices and/or wages fully reflect the benefits 8 eling up why not? 2. Oxana is conducting research on the demand for cleaner air in Novosibersk Sh notices that the Ministry of Housing built many identical dwellings around the city Why or V 20OLCIMOO :S Problems 175 CbkICE WE approximately the same distance from the center. The only difference is the average level of air pollution. She notes the following rental prices and air pollution levels for these dwellings:Mard bord lfa dbotgedtan ttst S 21 lzab IS1G Pollution level (ug/m3) totheilog de Rent (R/month) red Brw nobollog sd) 30 497 frq dns: orbac 1ithster tr 50 492 2.80T8L B bos s0ovi 4 2 dob 70 485 (12:97 2010 1a2ur e1 e159u0 ebip 475 455 90 199 to 0fm 709 8010 boulbisd or tof 120 10 150 430 200 375 bumgye me d:20 120126fX 0 250 305 300 219 Mioibcoe Plot the relationship between pollution levels (on the horizontal axis) and rent (on the vertical axis). On a separate graph, plot the relationship between pollution levels (on the horizontal axis) and the marginal valuation of pollution implicit in the relation- ship between rents and pollution levels (on the vertical axis). T0

Chapter7: Market Efficiency And Welfare
Section: Chapter Questions
Problem 2P

Related questions
Question
i need help with question 2

Transcribed Image Text:prices and/or wages fully reflect the benefits 8 eling up
why not?
2. Oxana is conducting research on the demand for cleaner air in Novosibersk Sh
notices that the Ministry of Housing built many identical dwellings around the city
Why or
Transcribed Image Text:V
20OLCIMOO :S Problems 175
CbkICE WE
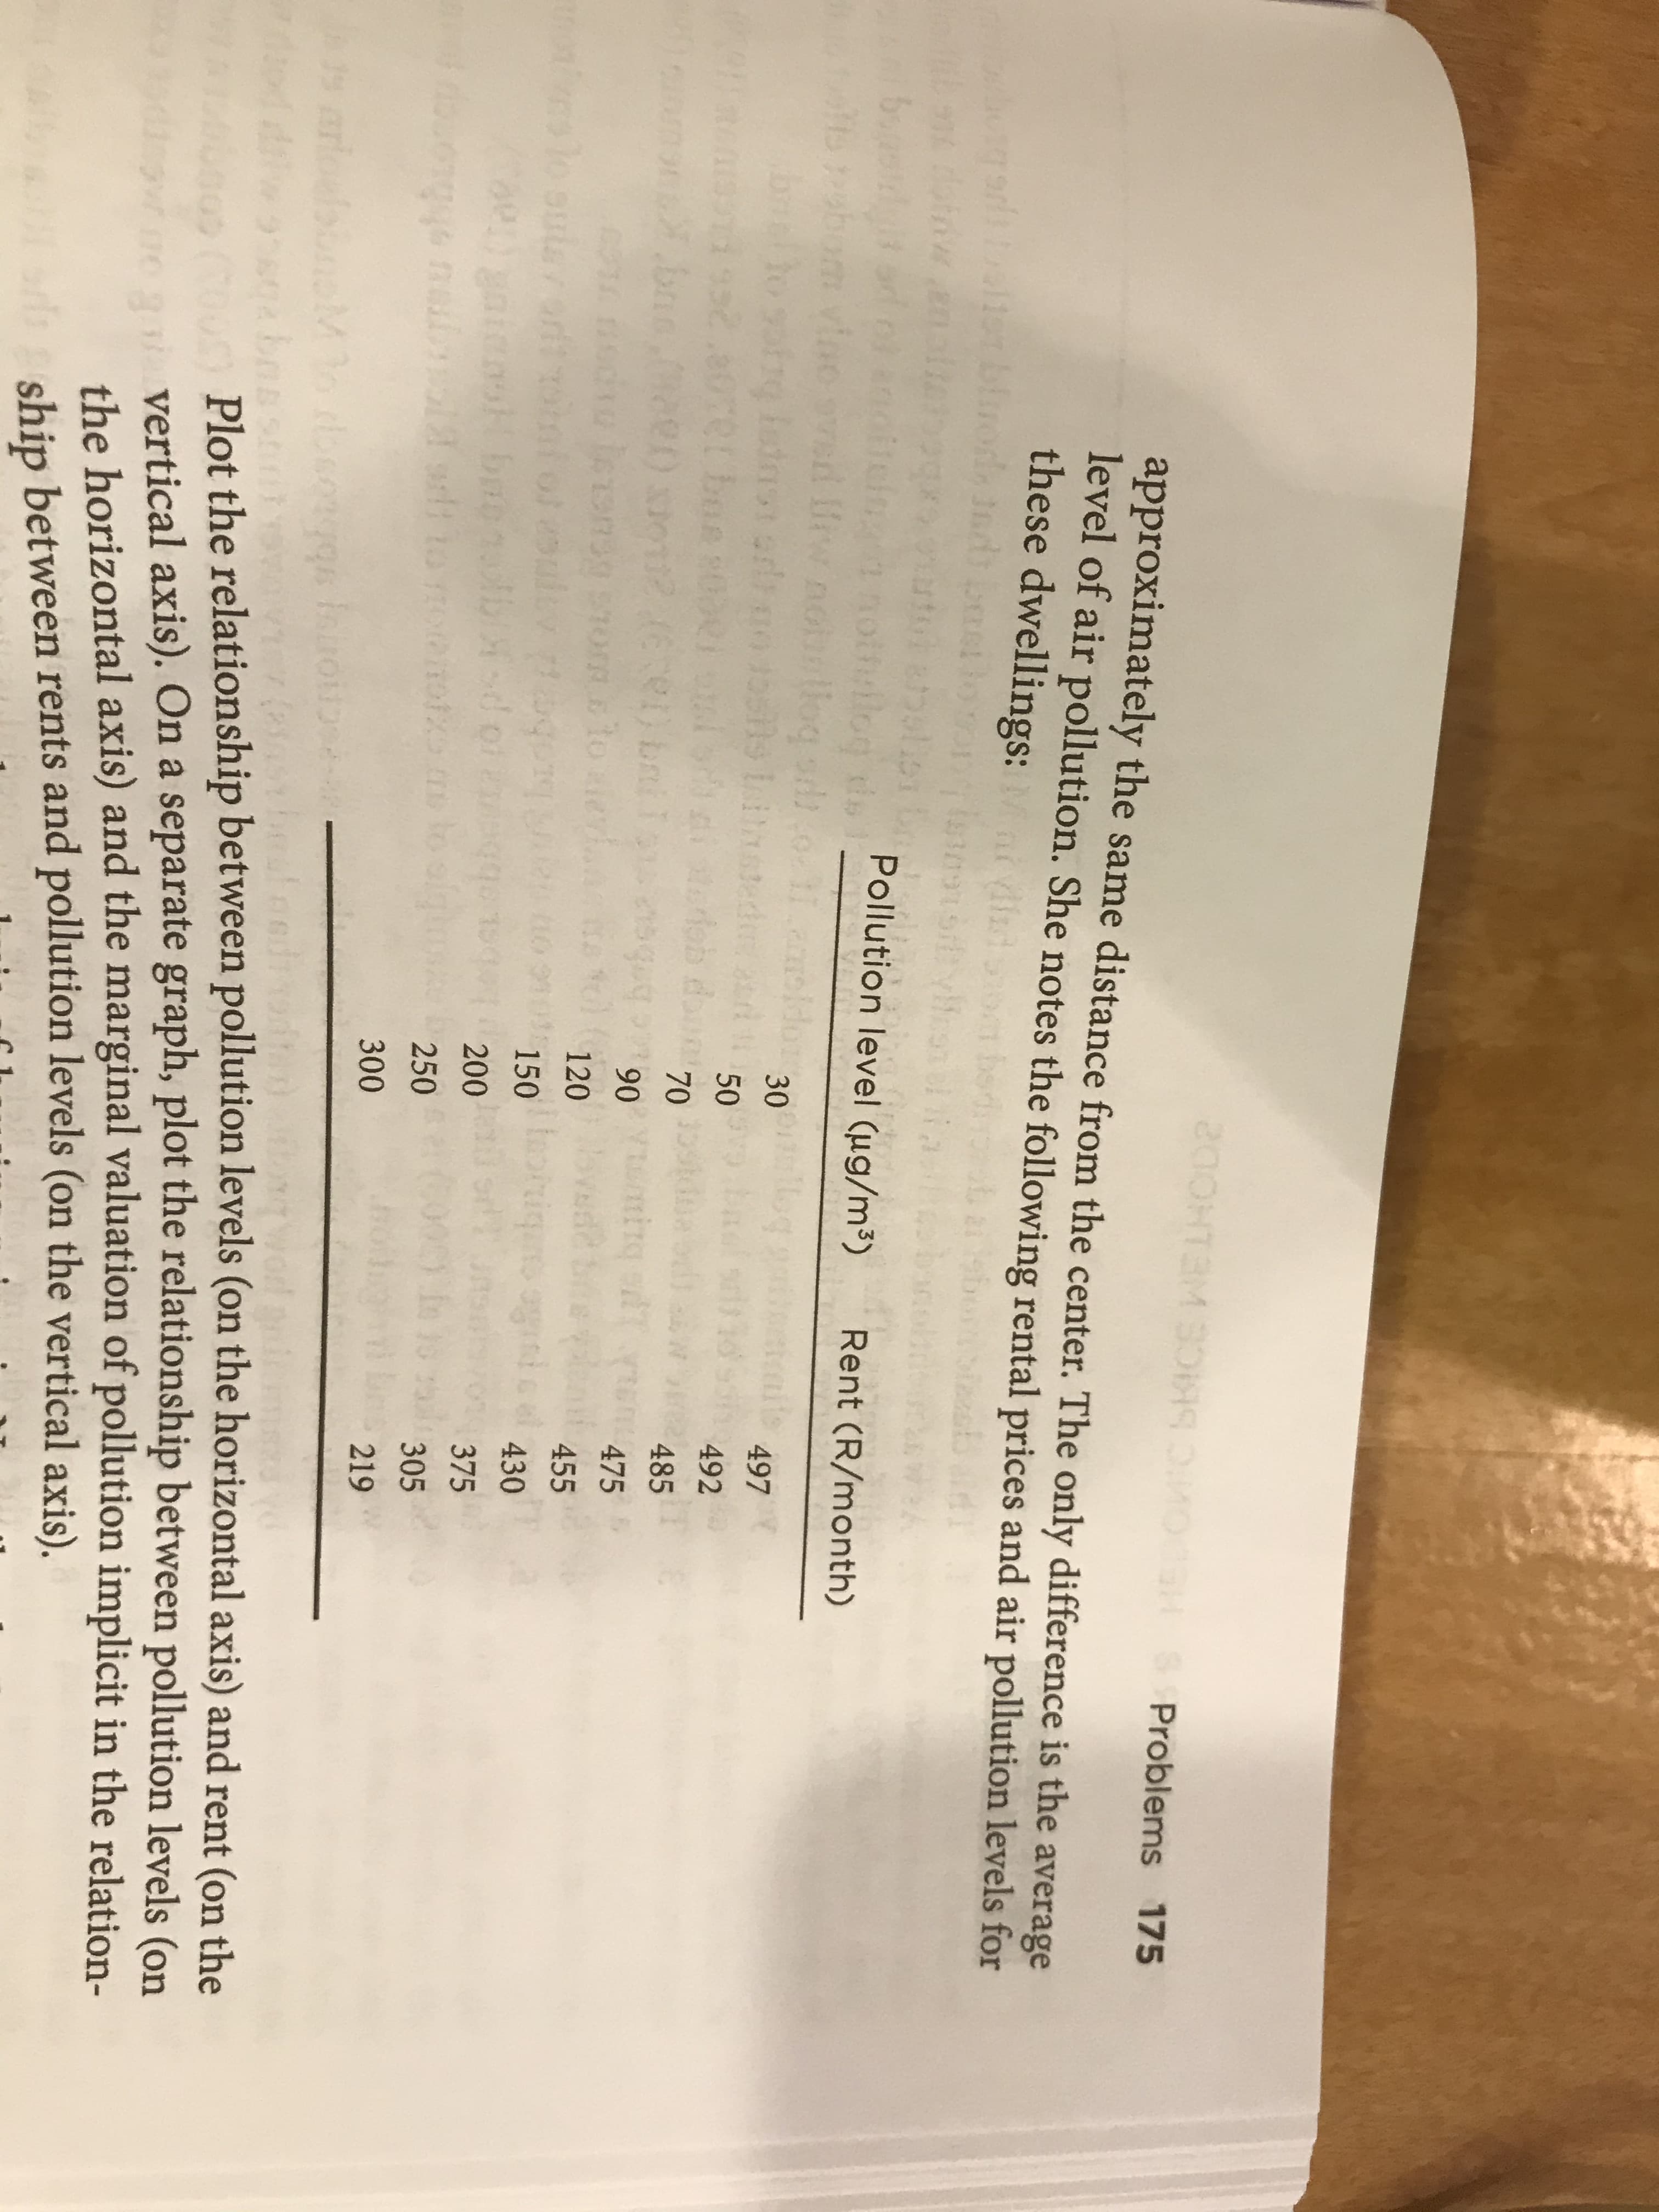
approximately the same distance from the center. The only difference is the average
level of air pollution. She notes the following rental prices and air pollution levels for
these dwellings:Mard
bord
lfa
dbotgedtan
ttst
S
21
lzab
IS1G
Pollution level (ug/m3)
totheilog de
Rent (R/month)
red Brw nobollog sd)
30
497
frq
dns: orbac
1ithster
tr
50
492
2.80T8L B
bos s0ovi
4 2
dob
70
485
(12:97 2010 1a2ur e1
e159u0
ebip
475
455
90
199
to
0fm
709
8010 boulbisd or
tof
120
10
150
430
200
375
bumgye me
d:20 120126fX 0
250
305
300
219
Mioibcoe
Plot the relationship between pollution levels (on the horizontal axis) and rent (on the
vertical axis). On a separate graph, plot the relationship between pollution levels (on
the horizontal axis) and the marginal valuation of pollution implicit in the relation-
ship between rents and pollution levels (on the vertical axis).
T0
Expert Solution
This question has been solved!
Explore an expertly crafted, step-by-step solution for a thorough understanding of key concepts.

This is a popular solution!

Trending now
This is a popular solution!

Step by step
Solved in 2 steps with 2 images

Knowledge Booster


Learn more about
Need a deep-dive on the concept behind this application? Look no further. Learn more about this topic, economics and related others by exploring similar questions and additional content below.Recommended textbooks for you
Exploring Economics
Economics
ISBN:
9781544336329
Author:
Robert L. Sexton
Publisher:
SAGE Publications, Inc

Principles of Economics 2e
Economics
ISBN:
9781947172364
Author:
Steven A. Greenlaw; David Shapiro
Publisher:
OpenStax
Exploring Economics
Economics
ISBN:
9781544336329
Author:
Robert L. Sexton
Publisher:
SAGE Publications, Inc
Principles of Economics 2e
Economics
ISBN:
9781947172364
Author:
Steven A. Greenlaw; David Shapiro
Publisher:
OpenStax