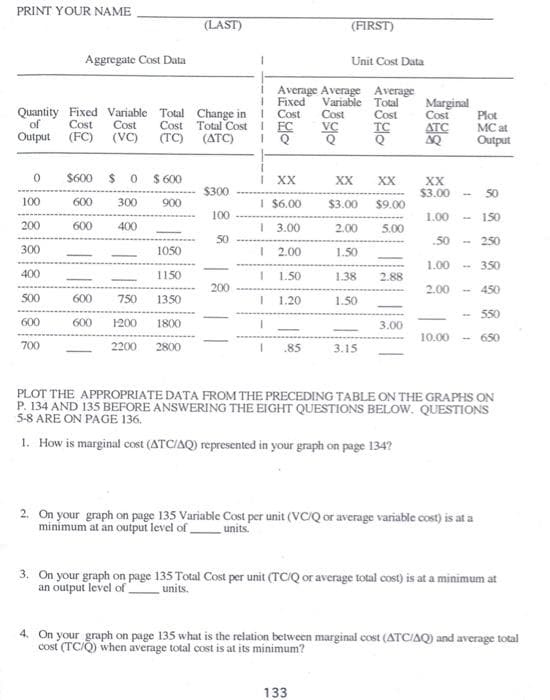
PRINT YOUR NAME (LAST) (FIRST) Aggregate Cost Data Unit Cost Data i Average Average Average IFixed Cost Variable Total Cost Cost VC TC Q Marginal Quantity Fixed Variable Total Change inI Cost Cost of Output (FC) (VC) Cost Total Cost I FC (TC) (ATC) Plot MC at Output Cost ATC Q $600 $ 0 $ 600 I XX XX XX XX $3.00 $300 50 100 600 300 900 I $6.00 $3.00 $9.00 100 1.00 150 200 600 400 | 3.00 2.00 5.00 50 .50 250 300 1050 2.00 1.50 1.00 350 400 1150 1.50 1.38 2.88 200 2.00 450 500 600 750 1350 1.20 1.50 - 550 600 600 1200 1800 3.00 10.00 650 700 2200 2800 .85 3.15 PLOT THE APPROPRIATE DATA FROM THE PRECEDING TABLE ON THE GRAPHS ON P. 134 AND 135 BEFORE ANSWERING THE EIGHT QUESTIONS BELOW. QUESTIONS 5-8 ARE ON PAGE 136. 1. How is marginal cost (ATC/AQ) represented in your graph on page 134? 2. On your graph on page 135 Variable Cost per unit (VC/Q or average variable cost) is at a minimum at an output level of units. 3. On your graph on page 135 Total Cost per unit (TC/Q or average total cost) is at a minimum at an output level of units. 4. On your graph on page 135 what is the relation between marginal cost (ATCIAQ) and average total cost (TC/Q) when average total cost is at its minimum?
PRINT YOUR NAME (LAST) (FIRST) Aggregate Cost Data Unit Cost Data i Average Average Average IFixed Cost Variable Total Cost Cost VC TC Q Marginal Quantity Fixed Variable Total Change inI Cost Cost of Output (FC) (VC) Cost Total Cost I FC (TC) (ATC) Plot MC at Output Cost ATC Q $600 $ 0 $ 600 I XX XX XX XX $3.00 $300 50 100 600 300 900 I $6.00 $3.00 $9.00 100 1.00 150 200 600 400 | 3.00 2.00 5.00 50 .50 250 300 1050 2.00 1.50 1.00 350 400 1150 1.50 1.38 2.88 200 2.00 450 500 600 750 1350 1.20 1.50 - 550 600 600 1200 1800 3.00 10.00 650 700 2200 2800 .85 3.15 PLOT THE APPROPRIATE DATA FROM THE PRECEDING TABLE ON THE GRAPHS ON P. 134 AND 135 BEFORE ANSWERING THE EIGHT QUESTIONS BELOW. QUESTIONS 5-8 ARE ON PAGE 136. 1. How is marginal cost (ATC/AQ) represented in your graph on page 134? 2. On your graph on page 135 Variable Cost per unit (VC/Q or average variable cost) is at a minimum at an output level of units. 3. On your graph on page 135 Total Cost per unit (TC/Q or average total cost) is at a minimum at an output level of units. 4. On your graph on page 135 what is the relation between marginal cost (ATCIAQ) and average total cost (TC/Q) when average total cost is at its minimum?

Chapter6: Proudction Costs
Section: Chapter Questions
Problem 8SQP

Related questions
Question
Transcribed Image Text:PRINT YOUR NAME
(LAST)
(FIRST)
Aggregate Cost Data
Unit Cost Data
Average Average Average
I Fixed
Variable Total
Cost
TC
Marginal
Quantity Fixed Variable Total Change in I Cost
of
Output (FC) (VC)
Cost
ATC
Cost
Cost Total Cost
(TC) (ATC)
Plot
MC at
Output
Cost
Cost
IFC
VC
$600 $ 0 $ 600
I XX
XX
XX
XX
$3.00
$300
50
100
600
300
900
I $6.00
$3.00
$9.00
100
1.00
150
200
600
400
| 3.00
2.00
5.00
50
.50
- 250
300
1050
I 2.00
1.50
1.00
350
400
1150
I 1.50
1.38
2.88
200
2.00
- 450
500
600
750
1350
I 1.20
1.50
550
600
600
1200
1800
3.00
10.00 - 650
700
2200
2800
I.85
3.15
PLOT THE APPROPRIATE DATA FROM THE PRECEDING TABLE ON THE GRAPHS ON
P. 134 AND 135 BEFORE ANSWERING THE EIGHT QUESTIONS BELOW. QUESTIONS
5-8 ARE ON PAGE 136.
1. How is marginal cost (ATC/AQ) represented in your graph on page 134?
2. On your graph on page 135 Variable Cost per unit (VC/Q or average variable cost) is at a
minimum at an output level of,
units.
3. On your graph on page 135 Total Cost per unit (TC/Q or average total cost) is at a minimum at
an output level of
units.
4. On your graph on page 135 what is the relation between marginal cost (ATCIAQ) and average total
cost (TC/Q) when average total cost is at its minimum?
133
Expert Solution
This question has been solved!
Explore an expertly crafted, step-by-step solution for a thorough understanding of key concepts.

This is a popular solution!

Trending now
This is a popular solution!

Step by step
Solved in 2 steps with 1 images

Knowledge Booster


Learn more about
Need a deep-dive on the concept behind this application? Look no further. Learn more about this topic, economics and related others by exploring similar questions and additional content below.Recommended textbooks for you


Microeconomics: Principles & Policy
Economics
ISBN:
9781337794992
Author:
William J. Baumol, Alan S. Blinder, John L. Solow
Publisher:
Cengage Learning
Microeconomics: Principles & Policy
Economics
ISBN:
9781337794992
Author:
William J. Baumol, Alan S. Blinder, John L. Solow
Publisher:
Cengage Learning

Managerial Economics: A Problem Solving Approach
Economics
ISBN:
9781337106665
Author:
Luke M. Froeb, Brian T. McCann, Michael R. Ward, Mike Shor
Publisher:
Cengage Learning

Principles of Economics 2e
Economics
ISBN:
9781947172364
Author:
Steven A. Greenlaw; David Shapiro
Publisher:
OpenStax
