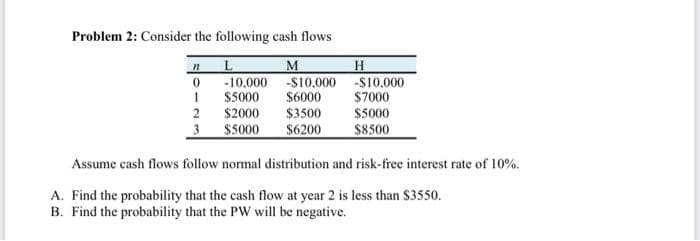
Problem 2: Consider the following cash flows M -10,000 -$10.000 -$10.000 S6000 $5000 S7000 2 $2000 $3500 S5000 3 $5000 $6200 $8500 Assume cash flows follow normal distribution and risk-free interest rate of 10%. A. Find the probability that the cash flow at year 2 is less than $3550. B. Find the probability that the PW will be negative.


Q: Larger standard error of an estimated parameter will lead to narrower confidence intervals. True…
A: From the provided information, The statement is that standard error of an estimated parameter will…
Q: Based on the information in the ANOVA table below, what is the Fcrit value for an a = 0.05. SS df MS…
A: The given ANOVA table is: The blank values are to be obtained, using the interpretations as:…
Q: in order to ensure that there is not a large disparity in the quality of education at various…
A: Step 1: Consider that σ2 is the population variance of mean standardized-test scores for all…
Q: The table below shows the color and the model of cars purchased by 160 randomly selected customers…
A: There are two categorical variables which are color and model. We have to test whether the clolor…
Q: MEAN MEDIAN MODE RANGE
A: Here ascending order of given data 32, 34, 41, 42, 43, 43, 43, 45, 49, 49, 50, 51, 52, 52, 55,…
Q: Refer to the following partial contingency table of probabilities that links the mode of…
A:
Q: Let X be the distance in kilometers that a tyre travels before being replaced. Historical data…
A: Given Mean μ=60,000, Coefficient of variation=Cv=0.25 X=67680
Q: Construct a frequency distribution table for the given scores of 30 students from an examination and…
A:
Q: Let the temperature at 8 AM be the first sample, and the temperature at 12 AM be the second sample.…
A: Given: Temperature at 8 AM Temperature at at 12 AM 97.9 98.3 99.5 100.2 97.3 97.7 97.5…
Q: The lengths of pregnancies in a small rural village are normally distributed with a mean of 268 days…
A:
Q: An e-marketing consultant is hired to determine how long customers spend, on average, on a company's…
A: The random variable length of time spent on the company's website follows normal distribution. We…
Q: 2. Determine za for the following values of a: a. a = 0.063 b. a = 0.05 c. a = 0.10
A:
Q: VIII. Susan is taking West teaching the course has a history of passing 67% of the students in…
A: Susan is taking Western Civilization this semester on a pass/fail basis. The department teaching the…
Q: c) The amount of sodium sulfate, in mg, found in the bottled water follows a normal distribution…
A: We have given that Mean(µ) = 13Standard deviations (σ) = 2.5X ~ N (µ, σ )= N (13,2.5)
Q: parts (a) through (c). Temperature (°F) 50-59 60-69 70-79 80-89 90-99 100-109 Days 305 1448 1509 346…
A: By using online calculator Mu = 79.8 and std = 8.0
Q: Run a regression analysis on the following bivariate set of data with y as the response variable. x…
A: Correlation coefficient is given by, H0: the correlation is not significant. H1: the correlation…
Q: A national chain of department stores ranks its 900,000 salespeople by the monetary value of their…
A: The objective is to find out which of the given statement is true about Keith's and Donna's sales…
Q: A city official would like to estimate the mean age of all residents of Jensen Beach. The standard…
A: Given that s.d =18 ,E = 3.3,ALPHA =0.05 n =?
Q: 1- Demand for a new working out product of Sportex during the last 90 days is shown in the below…
A: Given information: Demand Frequency 10 10 12 10 15 30 20 20 30 15 40 5 Sum 90
Q: 3. In the U.S. air pollution data are reported for 57 cities. Construct a frequency distribution and…
A:
Q: For a confidence level of 80% with a sample size of 27, find the critical t value.
A:
Q: A statistics class weighed 20 bags of grapes purchased from the store. The bags are advertised to…
A: Given that True mean=Population mean=16 90% confidence interval for the true mean weight of bags of…
Q: actual answer
A: P-value is the probability that the observed statistic has occurred by chance assuming that the null…
Q: Male and female populations of humpback whales under 80 years old are represented by age in the…
A: b) Population mean and standard deviation of age for females
Q: According to the Center for Disease Control (CDC) during the 2018-2019 season the percent of…
A: Given that p=45.3%=0.453 , n=500 , X=200 Level of significance=5%
Q: People with O-negative blood are called "universal donors" because O- negative blood can be given to…
A: A continuous random variable X is said to follow Normal distribution with parameters μ and σ2 if its…
Q: Interest centers around the life of an electronic component. Suppose it is known that the…
A:
Q: 0.4 D 0.1 0.3 0.2
A:
Q: People with O-negative blood are called "universal donors" because O- negative blood can be given to…
A: Percentage of people having O-negative blood(p)=6%=0.06 Number of donors who come to blood…
Q: 1. If the value of the skewness is positive then shape of the distribution is 2. PP, 3. The variance…
A: Hi! Thank you for the question, As per the honor code, we are allowed to answer three sub-parts at a…
Q: Which of these formulas is correct? a. Differences in Means = Average Causal Effect - Selection…
A: Finding the correct formula
Q: What are the null and altemative hypotheses? Pno carper versus H, Ppe Caloulate the test statistic,…
A: Calculate the Sample means and sample standard deviation using Excel
Q: Sigma-squared refers to the population mean of a variable. a. True b. False
A: Since you have asked multiple questions, we will solve the first question for you. If you want any…
Q: a. Find the correlation coefficient: r = Round to 2 decimal places. b. The null and alternative…
A: Since you have posted a question with multiple sub-parts, we will solve first three subparts for…
Q: H= 44.89 (Type an integer or decimal rounded to two decimal places as needed.) (Type an integer or…
A: here given grouped distribution of age and corresponding number of people
Q: 2. A researcher wants to test if the mean GPAS (grade point averages) of all male and all female…
A:
Q: Find the 95% confidence interval and explain. O 0.40 - (0.0223)(1.96) = 0.3563 and 0.40 +…
A:
Q: Find the area under the standard normal curve which lies to the following conditions. Refer to the…
A: We will use Standard Normal table to find the required areas. Note : According to our guidelines we…
Q: Race time X-H in hours For For X2 For X3 Write the values in each of the blanks above (note-for i,…
A: Given: Values are denoted by, 2.7,5.1, 4.2 Mean is given to be μ=4
Q: 13. The following are properties of normal distribution EXCEPT A. The area under the normal curve is…
A: Given that The following properties of normal distribution except Note: According to bartleby…
Q: 40. What is the degree of freedom in a set of data if the sample size is 197 A. 17 B. 18 C. 19 D. 20
A: Note: Hi, thank you for the question. As per our company guideline we are supposed to answer only…
Q: 1. It gives a bell shaped curve when the data are plotted on a graph paper.
A:
Q: college would like to estimate the proportion of its students that work full-time while going to…
A: Given that n=389 , X=42
Q: Figure Perfect Incorporated is a women's figure salon that specializes in weight reduction programs.…
A: There are two dependent samples which are before and after introductory program. We have to test…
Q: MO21. The brightness of a television picture tube can be evaluated by measuring the amount of…
A:
Q: The table below shows how students performed based on their gender. Use the table to answer the…
A:
Q: 7. Determine the equation, which will represent the best line for the following set of data and plot…
A: Solution-: We want to find the best regression line for given data Also, we plot the graph of the…
Q: numbers (a, b, and c) are your assigned figures. Data: Units Cost 85 200 70 185 64 150 28 35 50 56…
A: Values of units and cost given We have to do regression analysis and to draw scatterplot and trend…
Q: As a senior high school student, how much time do you spent in studying and answering the activities…
A: The following information has been given: The population mean is μ=25. The population standard…
Q: Erica is an inventor. Her portfolio tacks the performance of Google and wants to add the stock of…
A: Let the random variables, X and Y represent the Google data and Apple data, respectively. The…

Step by step
Solved in 2 steps

- QUESTION 6 The following is a payoff table giving profits for various situations. State 1 State 2 State 3 Probability 0.4 0.35 0.25 Alternative 1 45 37 83 Alternative 2 16 59 72 Alternative 3 23 65 91 Alternative 4 44 33 55 If a person were to use the expected monetary value criterion, what decision would be made? Alternative 1 Alternative 2 Alternative 3 Alternative 4Question 5: A department store prints scratch-and-save discount coupons to distribute to its customers. The numbers for each present discount are shown in the table. Present Discount Number of Each type of discount Available 60% 50 50% 25000 30% 50000 10% 500,000 Determine the expected percent discount.The following data were taken from Miller Company's balance sheet: Dec. 31, Year 2 Dec. 31, Year 1 Total liabilities $150,000 $105,000 Total stockholders' equity 75,000 60,000 a. Compute the ratio of liabilities to stockholders' equity. Round your answers to one decimal place. Liabilities toStockholders' Equity 12/31/Year 2: fill in the blank 1 12/31/Year 1: fill in the blank 2 b. Has the creditors' risk increased or decreased from December 31, Year 1, to December 31, Year 2?
- Problem #01: Arrivals of a customers to payment counter in a bank follow poisson distribution with an average of 10 per hour. The service time follows negative exponential distribution with an average of 4 minutes.(a) What is the average number of customers in the Queue?(b) The bank will open one or more counter when the waiting time of a customer is at least 10 minutes. By how much the flow of arrivals should increase in order to justify the second counter? Problem #02: On the desk of an office of a Banking Company, the arrivals of the customers follow poisson law and an average at every 10 minutes a customer arrives. The officer responsible takes on an average 6 minutes to serve a customer, assuming the exponentially distributed. Find out the average arrival rates for(a) 1 hour(b) 15 minutes(c) 8 hoursQuestion 4 (Part B a-c)A petrol station in the capital Kingstown has a single pump manned by one attendant. Vehicles arrive at the rate of 20 customers per hour and petrol filling takes 2 minutes on an average. Assume the arrival rate is Poisson probability distribution and service rate is exponentially distributed. Arrivals tend to follow a Poisson distribution, and service times tend to be exponential. The attendant is paid $10 per hour, but because of lost goodwill and sales, station loses about $15 per hour of customer time spent waiting for the attendant to service and order. The Petrol station is considering adding a second pump with an attendant to service customers. The station would pay that person the same $10 per hour. What is the probability that no customers are in the system (Po)?b. What is the average number of customers waiting for service (Lq)?c. What is the average number of customers in the system (L)? SHOW ALL WORKINGSProblem 4-25 The Gorman Manufacturing Company must decide whether to manufacture a component part at its Milan, Michigan, plant or purchase the component part from a supplier. The resulting profit is dependent upon the demand for the product. The following payoff table shows the projected profit (in thousands of dollars): State of Nature Low Demand Medium Demand High Demand Decision Alternative s1 s2 s3 Manufacture, d1 -20 40 100 Purchase, d2 10 45 70 The state-of-nature probabilities are P(s1) = 0.35, P(s2) = 0.35, and P(s3) = 0.30. Use a decision tree to recommend a decision.Recommended decision: _____________(manufacture component or purchase component) Use EVPI to determine whether Gorman should attempt to obtain a better estimate of demand. _____________(yes or No) EVPI: $ ________________ (fill in the blank) A test market study of the potential demand for the product is expected to report either a favorable (F) or unfavorable (U) condition. The relevant…
- Question 3 The Bank of Canada is interested in studying the relationship between mortgage rates and median home prices. The data is provided below Year Interst rate Median home price 1988 10.30 183,800 1989 10.30 183,200 1990 10.10 174,900 1991 9.30 173,500 1992 8.40 172,900 1993 7.30 173,200 1994 8.40 173,200 1995 7.90 169,700 1996 7.60 174,500 1997 7.60 177,900 1998 6.90 188,100 1999 7.40 203,200 2000 8.10 230,200 2001 7.00 258,200 2002 6.50 309,800 2003 5.80 329,800 2004 5.80 431,000 2005 5.80 515,000 2006 6.40 537,000 2007 6.30 496,000 2008 6.00 352,000 2009 5.00 232,000 2010 4.70 291,700 2011 4.40 262,900 2012 3.60 299,200 2013 4.00 321,200 2014 4.10 373,500 2015 3.80 358,100 2016 3.60 382,500 2017 4.00 402,900 a) Estimate a…Consider the following table containing yields for mutual funds in different asset classes (small, mid, and large cap). Fund Yield by Asset Class Small Cap Mid Cap Large Cap Fund Yield (%) Fund Yield (%) Fund Yield (%) Explorer Value 2.04 Capital Value 0.96 Equity Income 3.24 Small-Cap Value Index Admiral 2.46 Mid-Cap Value Index Admiral 1.57 High Dividend Yield Index 3.50 Small-Cap Index Admiral Shares 1.49 Extended Market Index Admiral Shares 1.22 500 Index Admiral Shares 1.57 Strategic Small-Cap Equity 0.38 Mid-Cap Index Admiral Shares 1.52 Diversified Equity 1.23 Explorer 0.17 Mid-Cap Growth 2.76 FTSE Social Index 1.42 Small-Cap Growth Index Admiral 0.21 Capital Value 0.32 Growth Equity 2.52 Explorer Value 2.55 Strategic Equity 1.54 U.S. Growth 0.37 Small-Cap ETF 1.44 Capital Opportunity Admiral Shares 2.14 Windsor 1.64 sum of squares for treatmentssum of squares for error≈1.5986≈18.4205 Step 2 of 2 : Find the mean square for treatments. Round…Question 3 (Minimum-variance Hedging) A farmer has a crop of grapefruit juice that will be ready for harvest and sale as 150000 pounds of grapefruit juice in 3 months. He is worried about possible price changes, so he is considering hedging - a financial engineering technique that minimizes future uncertainties in the cash flow. Typically, hedging is carried out using futures contract. However, unfortunately, there is no futures contract for grapefruit juice, but there is a futures contract for orange juice. Still, the farmer might consider using the futures contract for orange juice as a replacement for futures contract for grapefruit juice, in the hope that these two contracts are highly correlated due to the similarity of the underlying products. Currently, the spot prices are $1.20 per pound for orange juice and $1.50 per pound for grapefruit juice. The standard deviation of the prices of orange juice and grapefruit juice is about 20% per year, and the correlation coefficient…
- ] Consider the following table containing yields for mutual funds in different asset classes (small, mid, and large cap). Fund Yield by Asset Class Small Cap Mid Cap Large Cap Fund Yield (%) Fund Yield (%) Fund Yield (%) Explorer Value 1.22 Capital Value 0.96 Equity Income 3.24 Small-Cap Value Index Admiral 2.46 Mid-Cap Value Index Admiral 0.52 High Dividend Yield Index 3.50 Small-Cap Index Admiral Shares 1.49 Extended Market Index Admiral Shares 1.22 500 Index Admiral Shares 0.52 Strategic Small-Cap Equity 2.61 Mid-Cap Index Admiral Shares 1.52 Diversified Equity 1.23 Explorer 0.17 Mid-Cap Growth 0.82 FTSE Social Index 1.42 Small-Cap Growth Index Admiral 0.21 Capital Value 0.32 Growth Equity 1.42 Explorer Value 1.32 Strategic Equity 1.54 U.S. Growth 0.37 Small-Cap ETF 1.44 Capital Opportunity Admiral Shares 1.27 Windsor 1.64 sum of squares for treatmentssum of squares for error≈1.7894≈15.7229 Step 1 of 2 : What are the degrees of freedom…Question 3 The Bank of Canada is interested in studying the relationship between mortgage rates and median home prices. The data is provided below Year interest rate (%) 1988 10.30 1989 10.30 1990 10.10 1991 9.30 1992 8.40 1993 7.30 1994 8.40 1995 7.90 1996 7.60 1997 7.60 1998 6.90 1999 7.40 2000 8.10 2001 7.00 2002 6.50 2003 5.80 2004 5.80 2005 5.80 2006 6.40 2007 6.30 2008 6.00 2009 5.00 2010 4.70 2011 4.40 2012 3.60 2013 4.00 2014 4.10 2015 3.80 2016 3.60 2017 4.00 Median home price $183,800 $183,200 $174,900 $173,500 $172,900 $173,200 $173,200 $169,700 $174,500 $177,900 $188,100 $203,200 $230,200 $258,200 $309,800 $329,800 $431,000 $515,000 $537,000 $496,000 $352,000 $232,000 $291,700 $262,900 $299,200 $321,200 $373,500 $358,100 $382,500 $402,900 a) Estimate a simple linear regression model and find the value of the parameters for the estimation of mortgage rates and the median home price b) Interpret the intercept and the slope coefficients…Question 2 As an investor, would you rather be in a situation that involves no risk at all? Formulate your response in light of the ongoing pandemic and how it may have affected various type of businesses favorably and unfavorably. How would you classify pandemic risk – systematic or unsystematic.


