Problem #2 - - The table below shows the same actual sales of a Product X sold by Company Y from January to December of 2019, as presented in Problem #1. Month 2-Month Moving Average Forecast-Sales (# of Product X) Actual Sales Absolute Value (# of Product X) of Errors 1,860 2,033 3,556 4,211 6,250 7,990 Jan/19 Feb/19 Mar/19 Apr/19 May/19 Jun/19 Jul/19 Aug/19 Sep/19 Oct/19 Nov/19 Dec/19 Jan/20 10,250 9,850 9,980 9,990 7,895 5,353 - Calculate the 2-month Moving Average Forecast for sales from March/2019 to a) January/2019 and enter them in the table above. b) Calculate the Absolute Value of Error for every forecasted month, from March/2019 to January/2020. Enter those values on the table above. c) Mean Absolute Percent Error (MAPE) for the 2-month Moving Average Forecast you created for Product X from March/2019 to January/2020. - Calculate the Mean Absolute Deviation (MAD), the Mean Squared Error (MSE) and the
Problem #2 - - The table below shows the same actual sales of a Product X sold by Company Y from January to December of 2019, as presented in Problem #1. Month 2-Month Moving Average Forecast-Sales (# of Product X) Actual Sales Absolute Value (# of Product X) of Errors 1,860 2,033 3,556 4,211 6,250 7,990 Jan/19 Feb/19 Mar/19 Apr/19 May/19 Jun/19 Jul/19 Aug/19 Sep/19 Oct/19 Nov/19 Dec/19 Jan/20 10,250 9,850 9,980 9,990 7,895 5,353 - Calculate the 2-month Moving Average Forecast for sales from March/2019 to a) January/2019 and enter them in the table above. b) Calculate the Absolute Value of Error for every forecasted month, from March/2019 to January/2020. Enter those values on the table above. c) Mean Absolute Percent Error (MAPE) for the 2-month Moving Average Forecast you created for Product X from March/2019 to January/2020. - Calculate the Mean Absolute Deviation (MAD), the Mean Squared Error (MSE) and the

MATLAB: An Introduction with Applications
6th Edition
ISBN:9781119256830
Author:Amos Gilat
Publisher:Amos Gilat
Chapter1: Starting With Matlab
Section: Chapter Questions
Problem 1P

Related questions
Question
help please
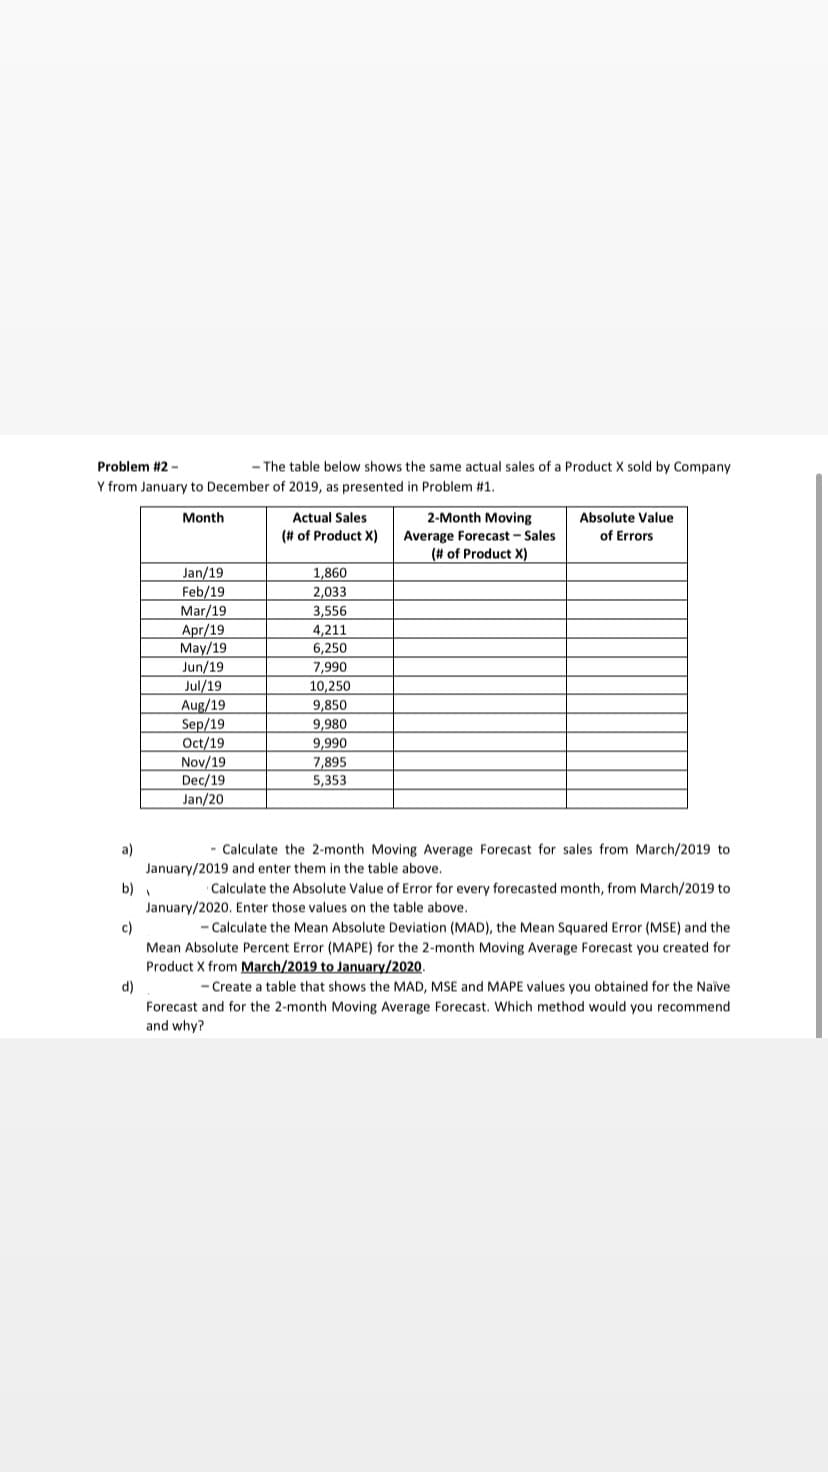
Transcribed Image Text:Problem #2 -
- The table below shows the same actual sales of a Product X sold by Company
Y from January to December of 2019, as presented in Problem #1.
Actual Sales
(# of Product X)
Month
2-Month Moving
Absolute Value
Average Forecast - Sales
(# of Product X)
of Errors
Jan/19
1,860
2,033
Feb/19
Mar/19
3,556
Apr/19
May/19
4,211
6,250
Jun/19
7,990
Jul/19
Aug/19
10,250
9,850
Sep/19
Oct/19
Nov/19
Dec/19
Jan/20
9,980
9,990
7,895
5,353
a)
January/2019 and enter them in the table above.
Calculate the 2-month Moving Average Forecast for sales from March/2019 to
Calculate the Absolute Value of Error for every forecasted month, from March/2019 to
b) .
January/2020. Enter those values on the table above.
c)
- Calculate the Mean Absolute Deviation (MAD), the Mean Squared Error (MSE) and the
Mean Absolute Percent Error (MAPE) for the 2-month Moving Average Forecast you created for
Product X from March/2019 to January/2020.
d)
- Create a table that shows the MAD, MSE and MAPE values you obtained for the Naïve
Forecast and for the 2-month Moving Average Forecast. Which method would you recommend
and why?
Expert Solution
This question has been solved!
Explore an expertly crafted, step-by-step solution for a thorough understanding of key concepts.

This is a popular solution!

Trending now
This is a popular solution!

Step by step
Solved in 4 steps

Recommended textbooks for you
MATLAB: An Introduction with Applications
Statistics
ISBN:
9781119256830
Author:
Amos Gilat
Publisher:
John Wiley & Sons Inc

Probability and Statistics for Engineering and th…
Statistics
ISBN:
9781305251809
Author:
Jay L. Devore
Publisher:
Cengage Learning

Statistics for The Behavioral Sciences (MindTap C…
Statistics
ISBN:
9781305504912
Author:
Frederick J Gravetter, Larry B. Wallnau
Publisher:
Cengage Learning
MATLAB: An Introduction with Applications
Statistics
ISBN:
9781119256830
Author:
Amos Gilat
Publisher:
John Wiley & Sons Inc
Probability and Statistics for Engineering and th…
Statistics
ISBN:
9781305251809
Author:
Jay L. Devore
Publisher:
Cengage Learning
Statistics for The Behavioral Sciences (MindTap C…
Statistics
ISBN:
9781305504912
Author:
Frederick J Gravetter, Larry B. Wallnau
Publisher:
Cengage Learning

Elementary Statistics: Picturing the World (7th E…
Statistics
ISBN:
9780134683416
Author:
Ron Larson, Betsy Farber
Publisher:
PEARSON

The Basic Practice of Statistics
Statistics
ISBN:
9781319042578
Author:
David S. Moore, William I. Notz, Michael A. Fligner
Publisher:
W. H. Freeman

Introduction to the Practice of Statistics
Statistics
ISBN:
9781319013387
Author:
David S. Moore, George P. McCabe, Bruce A. Craig
Publisher:
W. H. Freeman