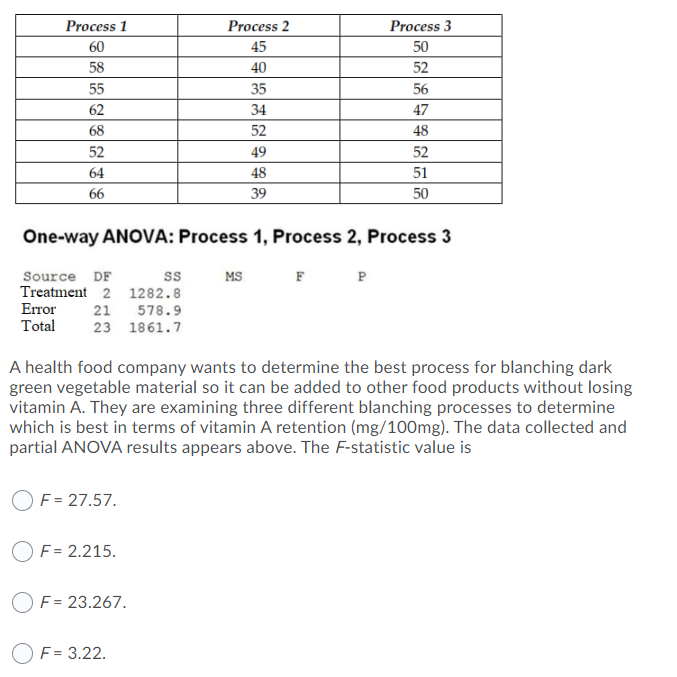
Process 1 Process 2 Process 3 60 45 50 58 40 52 55 35 56 62 34 47 68 52 48 52 49 52 64 48 51 66 39 50 One-way ANOVA: Process 1, Process 2, Process 3 Source DF Treatment 2 1282.8 Error ss MS F P 21 578.9 Total 23 1861.7 A health food company wants to determine the best process for blanching dark green vegetable material so it can be added to other food products without losing vitamin A. They are examining three different blanching processes to determine which is best in terms of vitamin A retention (mg/100mg). The data collected and partial ANOVA results appears above. The F-statistic value is F = 27.57. O F= 2.215. O F = 23.267. O F = 3.22.
Process 1 Process 2 Process 3 60 45 50 58 40 52 55 35 56 62 34 47 68 52 48 52 49 52 64 48 51 66 39 50 One-way ANOVA: Process 1, Process 2, Process 3 Source DF Treatment 2 1282.8 Error ss MS F P 21 578.9 Total 23 1861.7 A health food company wants to determine the best process for blanching dark green vegetable material so it can be added to other food products without losing vitamin A. They are examining three different blanching processes to determine which is best in terms of vitamin A retention (mg/100mg). The data collected and partial ANOVA results appears above. The F-statistic value is F = 27.57. O F= 2.215. O F = 23.267. O F = 3.22.

MATLAB: An Introduction with Applications
6th Edition
ISBN:9781119256830
Author:Amos Gilat
Publisher:Amos Gilat
Chapter1: Starting With Matlab
Section: Chapter Questions
Problem 1P

Related questions
Question
Transcribed Image Text:Process 1
Process 2
Process 3
60
45
50
58
40
52
55
35
56
62
34
47
68
52
48
52
49
52
64
48
51
66
39
50
One-way ANOVA: Process 1, Process 2, Process 3
Source DF
ss
MS
F
P
Treatment 2 1282.8
Error
21
578.9
Total
23 1861.7
A health food company wants to determine the best process for blanching dark
green vegetable material so it can be added to other food products without losing
vitamin A. They are examining three different blanching processes to determine
which is best in terms of vitamin A retention (mg/100mg). The data collected and
partial ANOVA results appears above. The F-statistic value is
F = 27.57.
O F = 2.215.
O F = 23.267.
F = 3.22.
Expert Solution
This question has been solved!
Explore an expertly crafted, step-by-step solution for a thorough understanding of key concepts.

This is a popular solution!

Trending now
This is a popular solution!

Step by step
Solved in 2 steps with 2 images

Recommended textbooks for you
MATLAB: An Introduction with Applications
Statistics
ISBN:
9781119256830
Author:
Amos Gilat
Publisher:
John Wiley & Sons Inc

Probability and Statistics for Engineering and th…
Statistics
ISBN:
9781305251809
Author:
Jay L. Devore
Publisher:
Cengage Learning

Statistics for The Behavioral Sciences (MindTap C…
Statistics
ISBN:
9781305504912
Author:
Frederick J Gravetter, Larry B. Wallnau
Publisher:
Cengage Learning
MATLAB: An Introduction with Applications
Statistics
ISBN:
9781119256830
Author:
Amos Gilat
Publisher:
John Wiley & Sons Inc
Probability and Statistics for Engineering and th…
Statistics
ISBN:
9781305251809
Author:
Jay L. Devore
Publisher:
Cengage Learning
Statistics for The Behavioral Sciences (MindTap C…
Statistics
ISBN:
9781305504912
Author:
Frederick J Gravetter, Larry B. Wallnau
Publisher:
Cengage Learning

Elementary Statistics: Picturing the World (7th E…
Statistics
ISBN:
9780134683416
Author:
Ron Larson, Betsy Farber
Publisher:
PEARSON

The Basic Practice of Statistics
Statistics
ISBN:
9781319042578
Author:
David S. Moore, William I. Notz, Michael A. Fligner
Publisher:
W. H. Freeman

Introduction to the Practice of Statistics
Statistics
ISBN:
9781319013387
Author:
David S. Moore, George P. McCabe, Bruce A. Craig
Publisher:
W. H. Freeman