Production Possibilities Model Production Possibilities for the country of Vulcan. Rocket Boots Tacos 50 40 30 20 10 250 450 600 700 750 In the space below, draw and label the production possibilities curve using the schedule above. Place Tacos on the horizontal axis. 1. The country of Vulcan invests in a faster Rocket Boot processing machine. What will happen to the production possibilities curve of Vulcan? (estimate, I'm not looking for exact numbers) Explain below and show on the chart above.
Production Possibilities Model Production Possibilities for the country of Vulcan. Rocket Boots Tacos 50 40 30 20 10 250 450 600 700 750 In the space below, draw and label the production possibilities curve using the schedule above. Place Tacos on the horizontal axis. 1. The country of Vulcan invests in a faster Rocket Boot processing machine. What will happen to the production possibilities curve of Vulcan? (estimate, I'm not looking for exact numbers) Explain below and show on the chart above.

Principles of Economics 2e
2nd Edition
ISBN:9781947172364
Author:Steven A. Greenlaw; David Shapiro
Publisher:Steven A. Greenlaw; David Shapiro
Chapter12: Environmental Protection And Negative Externalities
Section: Chapter Questions
Problem 39CTQ: Technological innovations shift the production possibility curve. Look at graph you sketched for...

Related questions
Question
Need help with economics
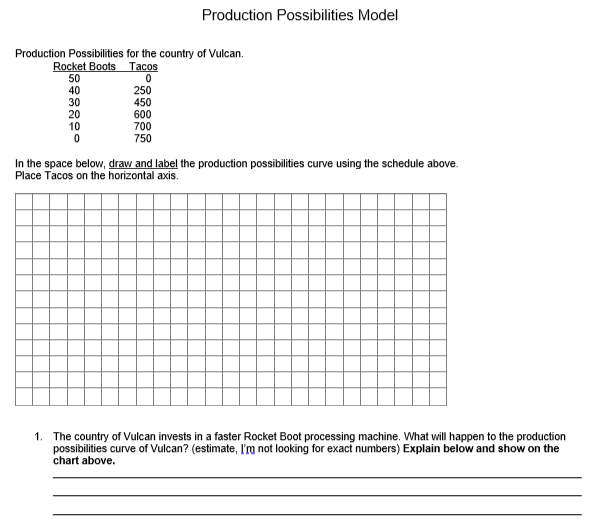
Transcribed Image Text:Production Possibilities Model
Production Possibilities for the country of Vulcan.
Rocket Boots Tacos
50
40
30
20
10
250
450
600
700
750
In the space below, draw and label the production possibilities curve using the schedule above.
Place Tacos on the horizontal axis.
1. The country of Vulcan invests in a faster Rocket Boot processing machine. What will happen to the production
possibilities curve of Vulcan? (estimate, I'm not looking for exact numbers) Explain below and show on the
chart above.
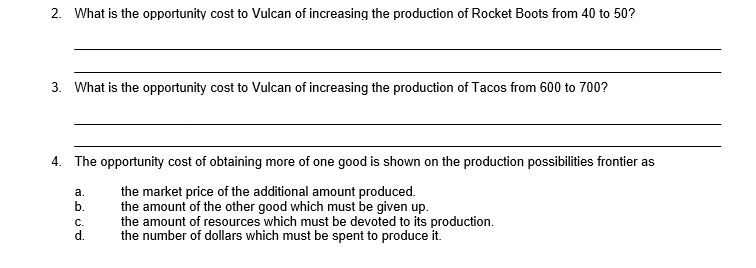
Transcribed Image Text:2. What is the opportunity cost to Vulcan of increasing the production of Rocket Boots from 40 to 50?
3. What is the opportunity cost to Vulcan of increasing the production of Tacos from 600 to 700?
4. The opportunity cost of obtaining more of one good is shown on the production possibilities frontier as
the market price of the additional amount produced.
the amount of the other good which must be given up.
the amount of resources which must be devoted to its production.
the number of dollars which must be spent to produce it.
а.
b.
С.
Expert Solution
This question has been solved!
Explore an expertly crafted, step-by-step solution for a thorough understanding of key concepts.

Step by step
Solved in 4 steps with 1 images

Knowledge Booster


Learn more about
Need a deep-dive on the concept behind this application? Look no further. Learn more about this topic, economics and related others by exploring similar questions and additional content below.Recommended textbooks for you
Principles of Economics 2e
Economics
ISBN:
9781947172364
Author:
Steven A. Greenlaw; David Shapiro
Publisher:
OpenStax
Principles of Economics 2e
Economics
ISBN:
9781947172364
Author:
Steven A. Greenlaw; David Shapiro
Publisher:
OpenStax