Profitability ratios: 1. 2. 3. 4. 5. 6. Return on equity Return on assets Gross profit percentage Net profit margin Earnings per share Quality of income
Profitability ratios: 1. 2. 3. 4. 5. 6. Return on equity Return on assets Gross profit percentage Net profit margin Earnings per share Quality of income

Intermediate Accounting: Reporting And Analysis
3rd Edition
ISBN:9781337788281
Author:James M. Wahlen, Jefferson P. Jones, Donald Pagach
Publisher:James M. Wahlen, Jefferson P. Jones, Donald Pagach
Chapter5: The Income Statement And The Statement Of Cash Flows
Section: Chapter Questions
Problem 10E

Related questions
Question
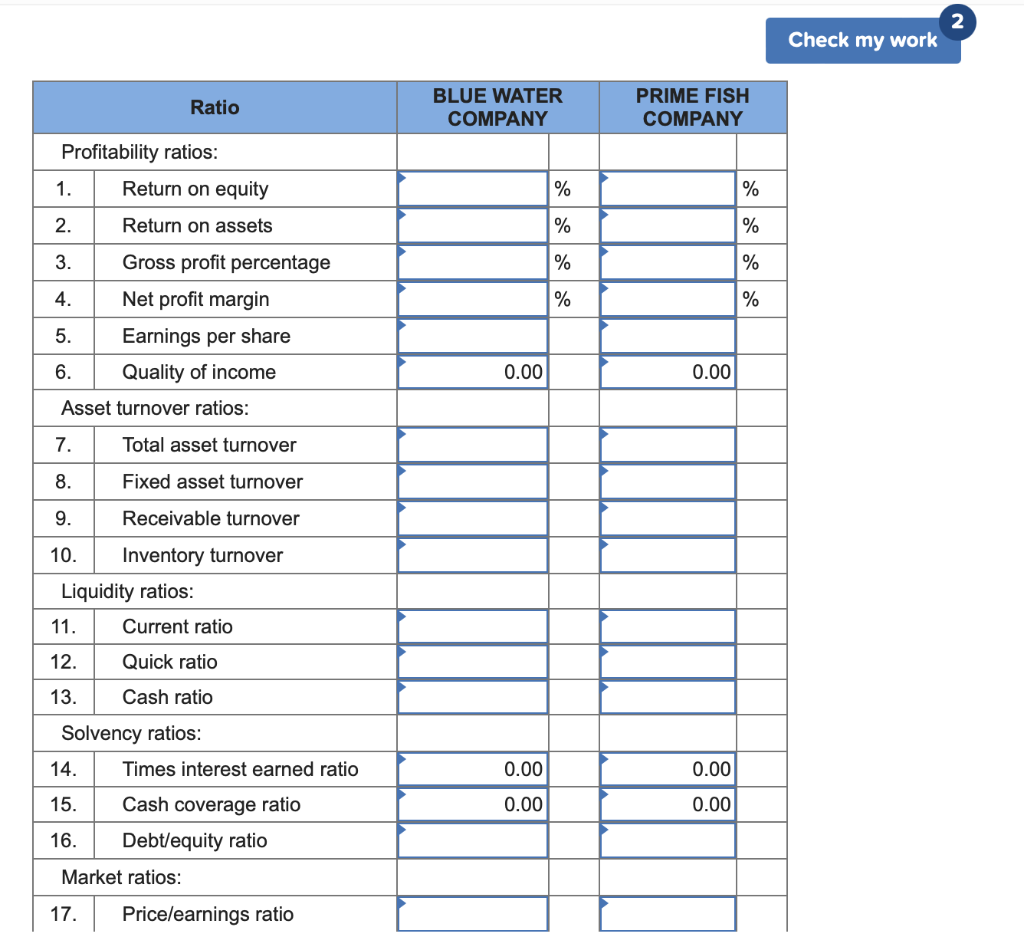
Transcribed Image Text:Profitability ratios:
1.
2.
3.
4.
5.
6.
7.
8.
9.
10.
Ratio
Asset turnover ratios:
Return on equity
Return on assets
Gross profit percentage
Net profit margin
11.
12.
13.
Earnings per share
Quality of income
Liquidity ratios:
Total asset turnover
Fixed asset turnover
Receivable turnover
Inventory turnover
Current ratio
Quick ratio
Cash ratio
Solvency ratios:
17.
14. Times interest earned ratio
15.
Cash coverage ratio
16.
Market ratios:
Debt/equity ratio
Price/earnings ratio
BLUE WATER
COMPANY
0.00
0.00
0.00
%
%
%
%
PRIME FISH
COMPANY
0.00
0.00
0.00
%
%
%
%
Check my work
2
Transcribed Image Text:2
Skipped
eBook
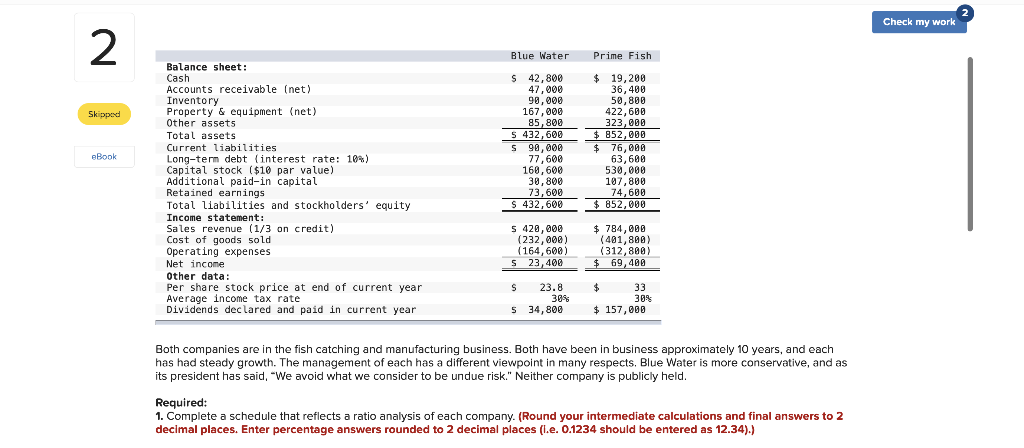
Balance sheet:
Cash
Accounts receivable (net)
Inventory
Property & equipment (net)
Other assets
Total assets
Current liabilities
Long-term debt (interest rate: 10%)
Capital stock ($10 par value)
Additional paid-in capital
Retained earnings
Total liabilities and stockholders' equity
Income statement:
Sales revenue (1/3 on credit)
Cost of goods sold.
Operating expenses
Net income
Other data:
Per share stock price at end of current year
Average income tax rate
Dividends declared and paid in current year
Blue Water
$ 42,800
47,000
90,000
167,000
85,800
S 432,600
S 90,000
77,600
160,600
30,800
73,600
$ 432,600
$ 420,000
(232,000)
(164,600)
S 23,400
S 23.8
30%
$ 34,800
Prime Fish
$ 19,200
36,400
50,800
422,600
323,000
$ 852,000
$76,000
63,600
530,000
107,800
74,600
$ 852,000
$ 784,000
(401,800)
(312,800)
$ 69,400
$
$ 157,000
33
30%
Both companies are in the fish catching and manufacturing business. Both have been in business approximately 10 years, and each
has had steady growth. The management of each has a different viewpoint in many respects. Blue Water is more conservative, and as
its president has said, "We avoid what we consider to be undue risk." Neither company is publicly held.
Required:
1. Complete a schedule that reflects a ratio analysis of each company. (Round your intermediate calculations and final answers to 2
decimal places. Enter percentage answers rounded to 2 decimal places (l.e. 0.1234 should be entered as 12.34).)
Check my work
Expert Solution
This question has been solved!
Explore an expertly crafted, step-by-step solution for a thorough understanding of key concepts.

Step by step
Solved in 3 steps

Knowledge Booster


Learn more about
Need a deep-dive on the concept behind this application? Look no further. Learn more about this topic, accounting and related others by exploring similar questions and additional content below.Recommended textbooks for you
Intermediate Accounting: Reporting And Analysis
Accounting
ISBN:
9781337788281
Author:
James M. Wahlen, Jefferson P. Jones, Donald Pagach
Publisher:
Cengage Learning

Financial Accounting: The Impact on Decision Make…
Accounting
ISBN:
9781305654174
Author:
Gary A. Porter, Curtis L. Norton
Publisher:
Cengage Learning

Survey of Accounting (Accounting I)
Accounting
ISBN:
9781305961883
Author:
Carl Warren
Publisher:
Cengage Learning
Intermediate Accounting: Reporting And Analysis
Accounting
ISBN:
9781337788281
Author:
James M. Wahlen, Jefferson P. Jones, Donald Pagach
Publisher:
Cengage Learning
Financial Accounting: The Impact on Decision Make…
Accounting
ISBN:
9781305654174
Author:
Gary A. Porter, Curtis L. Norton
Publisher:
Cengage Learning
Survey of Accounting (Accounting I)
Accounting
ISBN:
9781305961883
Author:
Carl Warren
Publisher:
Cengage Learning

Managerial Accounting
Accounting
ISBN:
9781337912020
Author:
Carl Warren, Ph.d. Cma William B. Tayler
Publisher:
South-Western College Pub

Cornerstones of Financial Accounting
Accounting
ISBN:
9781337690881
Author:
Jay Rich, Jeff Jones
Publisher:
Cengage Learning

Financial Accounting
Accounting
ISBN:
9781337272124
Author:
Carl Warren, James M. Reeve, Jonathan Duchac
Publisher:
Cengage Learning