Q. Draw a conclusion from the histogram


Q: The number of observations in a population is said to be the size of population. O True False
A: Here we want to know given statement is true or not.
Q: Which one is the qualitative date? O Eye color O Number of pens O both O None
A: Given that Qualitative data: The data which cannot be expressed as numerically is called…
Q: After giving a statistics exam, Professor Dang detemmined the following five-number summary for her…
A: Five number summary is a nice way to represent data It includes minimum, first quartile Q1, Second…
Q: The degrees of freedom for the sample containing 10 measurements is v = 10. True False
A:
Q: A student receives the following grades, with an A worth 4 points, a B worth 3 points, a C worth 2…
A: We have to find gpa.
Q: A sample has SS= 20 and s? = 4. How many scores are in the sample?
A: Six scores are in the sample.
Q: Mrs. Bollo's second grade class of 30 students conducted a pet ownership surve Results of the survey…
A:
Q: 17 In a bell-shaped data set with p = 15 and o = 5, approximately 95% of the data will .be between…
A: “Since you have asked multiple questions, we will solve the first question for you. If you want any…
Q: For which quartile, 25% observations are greater and 75% are smaller a. None O b. Third quartile O…
A: Answer:- Option D is correct answer.
Q: Based on the data below, what is the EXY ? Individual Y 1 4 4 3 9 6 4 7 8. O a. 575 O b. 529 О с.…
A: Given data, ∑xy =?
Q: The following pictograph shows the approximate attendance at four Big Sky High School winter…
A: Pictograph is a pictorial representation of data using symbols. The given pictograph is Here, each…
Q: Determine the sample size for the estimate of µ for the following: a) E=1.67, o = 11.44, b) E=0.55,…
A: a)GivenMargin of error(E)=1.67standard deviation(σ)=11.44Level of confidence(c)=98%
Q: Does this historgram follow a normal distributon and why? Based on the histogram, how many pigs…
A: Given a histogram showing the percentage of pigs and their weights in lbs.
Q: For which quartile, 25% observations are greater and 75% are smaller O a. Third quartile O b. Second…
A:
Q: Are the following data opprosimatily norme ercentile Score 10% 25% 50% 226 276 298
A: Null Hypothesis: H0: The distribution of the data is not approximately normal. Alternative…
Q: Find sample size CI=75% E=3.61 Stand. dev.=6.78
A:
Q: J.D. Power and Associates conducts vehicle quality surveys to provide automobile manufacturers with…
A: a. The data collected from this question is Categorical as the data collected will only include two…
Q: Given p = 0.6, q = 0.4 and o. = 0.006. Determine sample size from the given data. %3D %3D
A:
Q: For which quartile, 25% observations are greater and 75% are smaller O A None O B. First quartile O…
A: Third quartile: Q3=3n+14th term
Q: he day of the week for which 777 randomly selected fatal bicycle accidents occure hat the…
A: Applying Chi-square test, Expected frequency (E) = Total/n = 777/7 = 111 Chi-square test statistic…
Q: 3. Draw a histogram and locate mode from the following and verify with actual calculation. Class…
A:
Q: A boxplot for a set of 40 scores is given below. How many scores are represented in the blue section…
A: How many scores are represented in the blue section of the boxplot total scores are 40
Q: What are the conditions for a valid Instrument?
A: A valid instrument induces changes in the independent variable but has no independent effect on the…
Q: Variable List (a) Using the variables listed in the table above, Describe each variable. (b) State…
A: Ordinal variables are the categorical variables that can only be ranked. For example, you cannot put…
Q: A random sample of 14 married couples had their heights measured with the following results (X=man's…
A: Use Excel or any other software to draw the scatterplot.Steps of Excel:1. Enter the data.2. Go to…
Q: Given that Cheryl is collecting data on car color, what type of data is she working with
A: Quantitative data are numeric in number representing counts or measurements. It is of two types:…
Q: Your research question involves two samples and a comparison of means. What test does this lead you…
A: Paired t-test can be defined as a statistical technique that can be used to decide whether the mean…
Q: 1. Construct the X bar and R bar Chart for the following data.
A: We need to construct Control Charts
Q: Fill in the anova table Source SS df MS F effect 500 2 ? ? error…
A: Let K be the number of elements in effect N be the total number Farmula used F=MSeffect/MSerror
Q: Determine Q1, Q3, and the median from the combined scorce of two sections. Use the results to…
A: The Q1 and Q3 represent the 1st and the third quartile of the data that represent the values in the…
Q: Which of the following is not correct about diagram? O a. Requires drawing skill O b. Depict…
A: Not necessarily for diagram is not necessary to draw on plain paper because it may be graph paper.…
Q: Create an online survey of your section on "The Devices Available at Home Use for Learning" either…
A: Results of the survey is; Number of people who use smartphone = 20 Number of people who use laptop =…
Q: What would it be for the histogram box?
A: Graphs are used to represent the data in visual form. Each graph used for different purposes and…
Q: Please assist with a,b,c C. Is the p value greater than or lesser than the level of significance? Is…
A: Given,sample size(n)=37sample mean(x¯)=82.7standard deviation(σ)=28.6H0:μ=75H1:μ>75α=0.10
Q: A state employee wishes to see if there is a signifificant difference in the number of employees at…
A:
Q: Consider a sample with a (a) 20 to 40 75 % (b) 15 to 45 % (c) 22 to 38 (d) 17 to 43 % (e) 12 to 48 %
A: mean = 30 standard deviation = 5 i) P(20<X<40) = P(X<40) - P(X<20)…
Q: Find the third quartile for this list of numbers BY HAND 15 99 27 64 29 39 16 68 6 40 75 9 35 3 95
A: The given data set is, 15 27 29 16 6 75 35 95 99 64 39 68 40 9 3 Arrange the observations in…
Q: 17. How many observations are there?
A:
Q: The following are the percentages of tin in measure-ments made on 24 solder joints: 61 63 59 54 65…
A: a)
Q: A histogram which is not symmetrically bell-shaped is called shrewed O skewed stewed
A: we have to find term used for not symmetrically bell shaped histogram
Q: 2. A technician collected the following data after measuring the heights of a sample of plants that…
A: Use the given data to calculate the required quantities.
Q: The city council of Pine Bluffs is considering Increasing the number of police In an effort to…
A: Regression is one type of statistical procedure to study relationship between one dependent and one…
Q: 9. A set of data consists of 230 observations between $235 and $567. What ciass interval would you…
A: Given information N = 230 observations between $235 and $567 27 = 128 < 230 28 = 256 > 230 So,…
Q: All of the following should be included in the statistics statement in the writeup for a t test…
A: In write-up we mention claim, type of test, sample statistics, df= , t=, p-value, conclusion but we…
Q: The exam scores (out of 100 points) for all students taking an introductory statistics course are…
A: from given box plot, minimum = 25
Q: b. What is the value of the observed test statistic associated with the test? O x? 6.251 O x? =…
A:
Q: II. The following items appeared in a portion of the questionnaire to be filled up by an applicant…
A:
Q: Listed below are body temperatures from five different subjects measured at 8am and again at 12am.…
A:
Q: Consider the set of observations: 2, 5, 6, 0, 7, 9, 10. The values of the first and third quartiles…
A: The quartiles divide the data set into 4 equal parts. The first quartile is the one below which 25%…
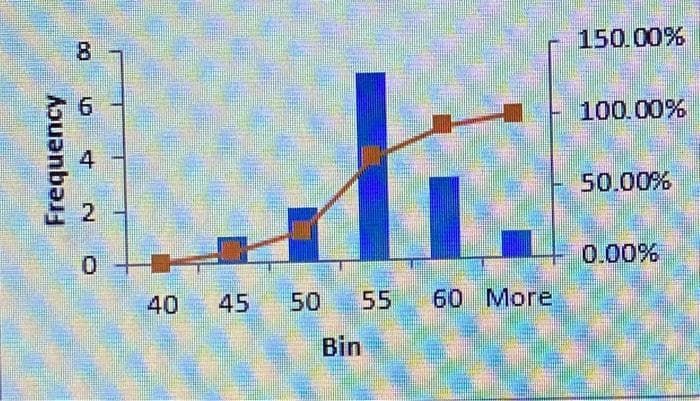
Q. Draw a conclusion from the histogram
NOTE: DO NOT COPY FROM OTHER WEBSITES

Step by step
Solved in 2 steps with 1 images

