Q.5 Collect the ages (in years) of all of your immediate family members (parents, siblings) and extended family members (grandparents, aunts, uncles, cousins). You should gather no more than 20 ages (in the case that you have a large family). a) Construct a table, with all the data present, that shows the individuals, their relationship to you, and age. b) Draw a pie graph, with percent labels, that shows the amount of individuals in the age categories below. babies (0 1); children (2 - 12); teens (13 - 19); young adults (20 - 29); adults (30 - 69); seniors (70 +). c) Find Mean, median, and mode age for all data. d) Find out variance and standard deviation for data.
Q.5 Collect the ages (in years) of all of your immediate family members (parents, siblings) and extended family members (grandparents, aunts, uncles, cousins). You should gather no more than 20 ages (in the case that you have a large family). a) Construct a table, with all the data present, that shows the individuals, their relationship to you, and age. b) Draw a pie graph, with percent labels, that shows the amount of individuals in the age categories below. babies (0 1); children (2 - 12); teens (13 - 19); young adults (20 - 29); adults (30 - 69); seniors (70 +). c) Find Mean, median, and mode age for all data. d) Find out variance and standard deviation for data.

Glencoe Algebra 1, Student Edition, 9780079039897, 0079039898, 2018
18th Edition
ISBN:9780079039897
Author:Carter
Publisher:Carter
Chapter10: Statistics
Section10.6: Summarizing Categorical Data
Problem 23PPS

Related questions

Question
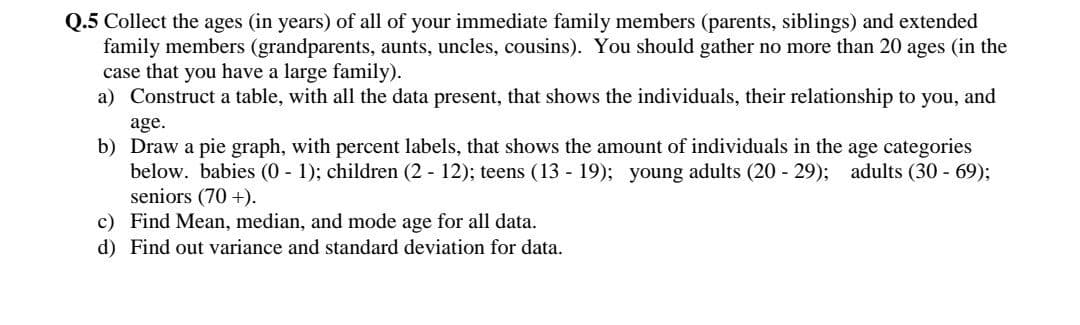
Transcribed Image Text:Q.5 Collect the ages (in years) of all of your immediate family members (parents, siblings) and extended
family members (grandparents, aunts, uncles, cousins). You should gather no more than 20 ages (in the
case that you have a large family).
a) Construct a table, with all the data present, that shows the individuals, their relationship to you, and
age.
b) Draw a pie graph, with percent labels, that shows the amount of individuals in the age categories
below. babies (0 1); children (2 12); teens (13 - 19); young adults (20 - 29); adults (30 - 69);
seniors (70 +).
c) Find Mean, median, and mode age for all data.
d) Find out variance and standard deviation for data.
Expert Solution
This question has been solved!
Explore an expertly crafted, step-by-step solution for a thorough understanding of key concepts.

This is a popular solution!

Trending now
This is a popular solution!

Step by step
Solved in 4 steps with 1 images

Knowledge Booster


Learn more about
Need a deep-dive on the concept behind this application? Look no further. Learn more about this topic, statistics and related others by exploring similar questions and additional content below.Recommended textbooks for you
Glencoe Algebra 1, Student Edition, 9780079039897…
Algebra
ISBN:
9780079039897
Author:
Carter
Publisher:
McGraw Hill
Glencoe Algebra 1, Student Edition, 9780079039897…
Algebra
ISBN:
9780079039897
Author:
Carter
Publisher:
McGraw Hill