Q14. The following table contains the measurements of the key length dimensions from a fuel injector.These samples of size five were taken at one -hour intervals. a. Construct a three-sigma x-chart and R-chart (use Exhibit 6.13) for the length of the fuel injector.what can you say about this process? The picture of Exhibit 6.13 is attached The picture with the sample number and observations also attached. Thanks
Q14. The following table contains the measurements of the key length dimensions from a fuel injector.These samples of size five were taken at one -hour intervals. a. Construct a three-sigma x-chart and R-chart (use Exhibit 6.13) for the length of the fuel injector.what can you say about this process? The picture of Exhibit 6.13 is attached The picture with the sample number and observations also attached. Thanks

Practical Management Science
6th Edition
ISBN:9781337406659
Author:WINSTON, Wayne L.
Publisher:WINSTON, Wayne L.
Chapter2: Introduction To Spreadsheet Modeling
Section: Chapter Questions
Problem 20P: Julie James is opening a lemonade stand. She believes the fixed cost per week of running the stand...

Related questions
Question
100%
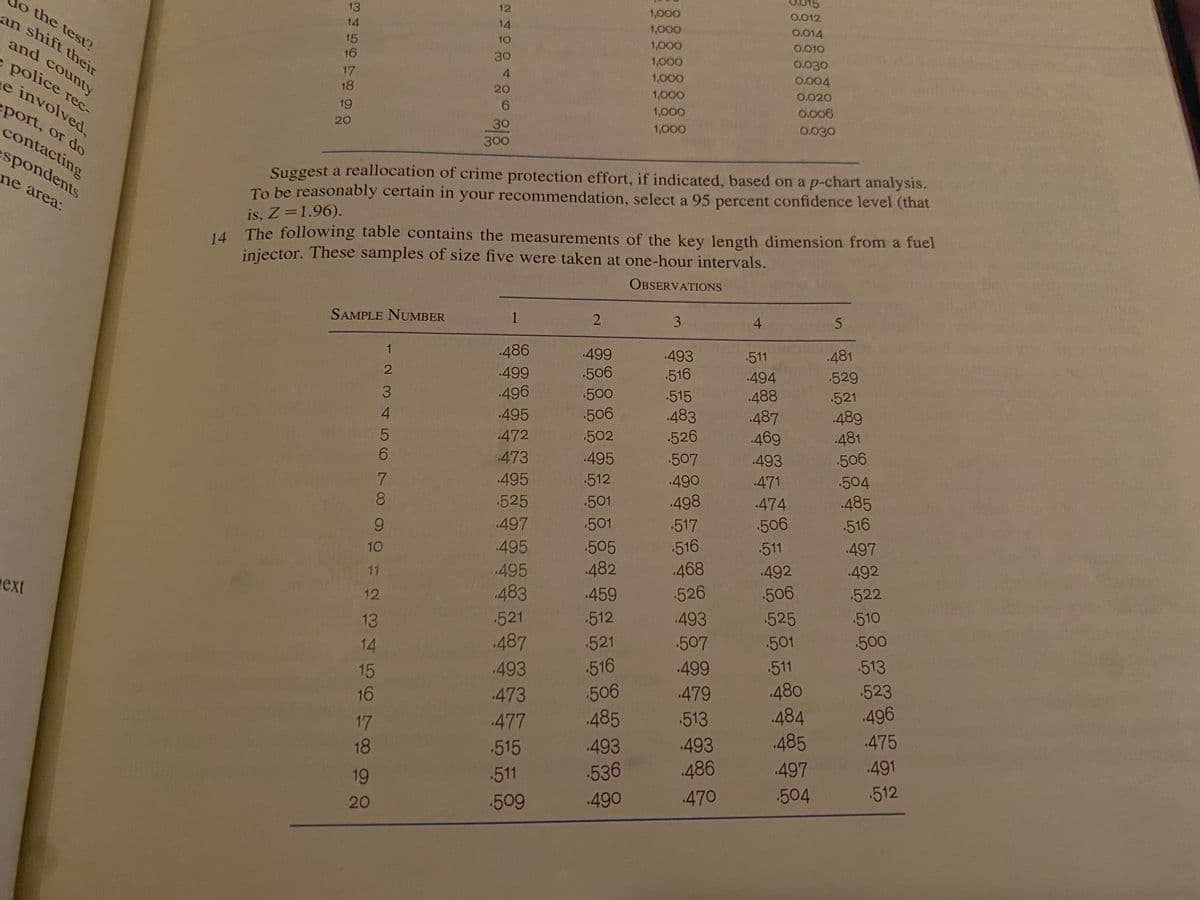
Q14. The following table contains the measurements of the key length dimensions from a fuel injector.These samples of size five were taken at one -hour intervals.
a. Construct a three-sigma x-chart and R-chart (use Exhibit 6.13) for the length of the fuel injector.what can you say about this process?
The picture of Exhibit 6.13 is attached
The picture with the sample number and observations also attached. Thanks
Transcribed Image Text:o the test?
an shift their
13
12
1,000
0.012
14
14
1,000
0.014
and county
15
16
10
1,000
0.010
30
1,000
e police rec-
e involved,
0.030
17
4.
18
1,000
0.004
20
1,000
0.020
19
port, or do
1,000
0.006
20
30
contacting
spondents
1,000
0.030
300
Suggest a reallocation of crime protection effort, if indicated, based on a p-chart analysis.
To be reasonably certain in your recommendation, select a 95 percent confidence level (that
ne area:
is, Z=1.96).
14
The following table contains the measurements of the key length dimension from a fuel
injector. These samples of size five were taken at one-hour intervals.
OBSERVATIONS
SAMPLE NUMBER
3
4
1
486
.499
.493
511
.481
.499
506
516
.494
529
3.
496
500
515
.488
.521
4.
.495
506
.483
487
.469
489
481
.472
502
526
473
495
507
493
506
.495
512
490
471
504
8.
525
485
516
501
498
.474
6.
497
501
517
506
10
495
505
516
511
497
468
526
482
495
483
11
492
492
ext
12
459
506
.522
13
521
512
493
525
510
14
487
521
507
501
500
15
493
516
499
511
513
480
484
.485
16
473
506
479
523
.477
485
513
496
17
18
515
.493
493
.475
19
511
536
486
497
.491
20
509
.490
.470
504
512
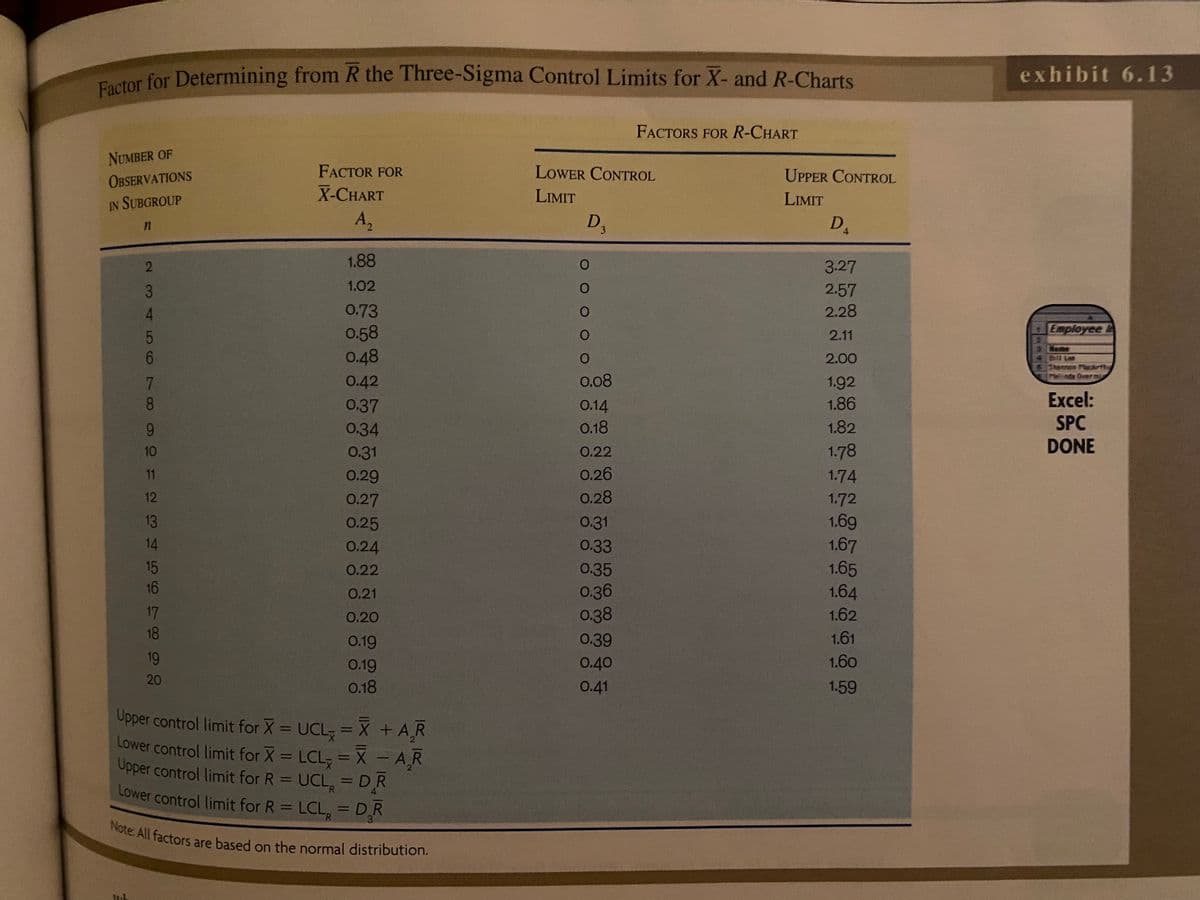
Transcribed Image Text:Factor for Determining from R the Three-Sigma Control Limits for X- and R-Charts
Note: All factors are based on the normal distribution.
stor for Determining from R the Three-Sigma Control Limits for X- and R-Charts
exhibit 6.13
FACTORS FOR R-CHART
NUMBER OF
FACTOR FOR
LOWER CONTROL
UPPER CONTROL
OBSERVATIONS
X-CHART
LIMIT
LIMIT
IN SUBGROUP
A2
D,
DA
3.
1.88
3.27
1.02
2.57
0.73
2.28
Employee
0.58
0.48
2.11
6.
2.00
annon Macrth
Overmi
0.42
0,08
1.92
8.
0.37
0.14
1.86
Excel:
SPC
DONE
9.
0.34
0.18
1.82
10
0.31
0.22
1.78
11
0.29
0.26
1.74
12
0.27
0.28
1.72
1.69
1.67
13
0.25
0.31
14
0.24
0.33
15
1.65
1.64
0.22
0.35
16
0.36
0.38
0.21
17
0.20
1.62
18
0.19
0.39
1.61
19
0.19
0.40
1.60
20
0.18
0.41
1.59
Upper control limit for X = UCL, = X + A,R
Lower control limit for X = LCL, =X - A,R
Upper control limit for R = UCL, = DR
Lower control limit for R = LCL, = DR
%3D
%3D
%3D
%3D
%3D
2 3 4 502 om
Expert Solution
This question has been solved!
Explore an expertly crafted, step-by-step solution for a thorough understanding of key concepts.

This is a popular solution!

Trending now
This is a popular solution!

Step by step
Solved in 2 steps with 11 images

Recommended textbooks for you
Practical Management Science
Operations Management
ISBN:
9781337406659
Author:
WINSTON, Wayne L.
Publisher:
Cengage,

Operations Management
Operations Management
ISBN:
9781259667473
Author:
William J Stevenson
Publisher:
McGraw-Hill Education

Operations and Supply Chain Management (Mcgraw-hi…
Operations Management
ISBN:
9781259666100
Author:
F. Robert Jacobs, Richard B Chase
Publisher:
McGraw-Hill Education
Practical Management Science
Operations Management
ISBN:
9781337406659
Author:
WINSTON, Wayne L.
Publisher:
Cengage,
Operations Management
Operations Management
ISBN:
9781259667473
Author:
William J Stevenson
Publisher:
McGraw-Hill Education
Operations and Supply Chain Management (Mcgraw-hi…
Operations Management
ISBN:
9781259666100
Author:
F. Robert Jacobs, Richard B Chase
Publisher:
McGraw-Hill Education


Purchasing and Supply Chain Management
Operations Management
ISBN:
9781285869681
Author:
Robert M. Monczka, Robert B. Handfield, Larry C. Giunipero, James L. Patterson
Publisher:
Cengage Learning

Production and Operations Analysis, Seventh Editi…
Operations Management
ISBN:
9781478623069
Author:
Steven Nahmias, Tava Lennon Olsen
Publisher:
Waveland Press, Inc.