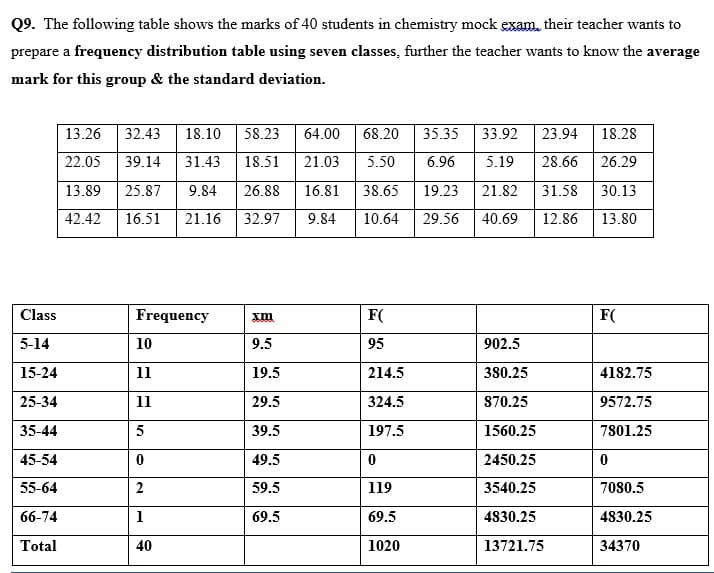
Q9. The following table shows the marks of 40 students in chemistry mock exam, their teacher wants to prepare a frequency distribution table using seven classes, further the teacher wants to know the averag mark for this group & the standard deviation. 13.26 32.43 18.10 58.23 64.00 68.20 35.35 33.92 23.94 18.28 22.05 39.14 31.43 18.51 21.03 5.50 6.96 5.19 28.66 26.29 13.89 25.87 9.84 26.88 16.81 38.65 19.23 21.82 31.58 30.13 42.42 16.51 21.16 32.97 9.84 10.64 29.56 40.69 12.86 13.80 Class Frequency F( F( 5-14 10 9.5 95 902.5 15-24 11 19.5 214.5 380.25 4182.75 25-34 11 29.5 324.5 870.25 9572.75 35-44 5 39.5 197.5 1560.25 7801.25 45-54 49.5 2450.25 55-64 2 59.5 119 3540.25 7080.5 66-74 1 69.5 69.5 4830.25 4830.25 Total 40 1020 13721.75 34370
Q9. The following table shows the marks of 40 students in chemistry mock exam, their teacher wants to prepare a frequency distribution table using seven classes, further the teacher wants to know the averag mark for this group & the standard deviation. 13.26 32.43 18.10 58.23 64.00 68.20 35.35 33.92 23.94 18.28 22.05 39.14 31.43 18.51 21.03 5.50 6.96 5.19 28.66 26.29 13.89 25.87 9.84 26.88 16.81 38.65 19.23 21.82 31.58 30.13 42.42 16.51 21.16 32.97 9.84 10.64 29.56 40.69 12.86 13.80 Class Frequency F( F( 5-14 10 9.5 95 902.5 15-24 11 19.5 214.5 380.25 4182.75 25-34 11 29.5 324.5 870.25 9572.75 35-44 5 39.5 197.5 1560.25 7801.25 45-54 49.5 2450.25 55-64 2 59.5 119 3540.25 7080.5 66-74 1 69.5 69.5 4830.25 4830.25 Total 40 1020 13721.75 34370

Glencoe Algebra 1, Student Edition, 9780079039897, 0079039898, 2018
18th Edition
ISBN:9780079039897
Author:Carter
Publisher:Carter
Chapter10: Statistics
Section10.4: Distributions Of Data
Problem 19PFA

Related questions

Concept explainers
Equations and Inequations
Equations and inequalities describe the relationship between two mathematical expressions.
Linear Functions
A linear function can just be a constant, or it can be the constant multiplied with the variable like x or y. If the variables are of the form, x2, x1/2 or y2 it is not linear. The exponent over the variables should always be 1.
Question
9- Please I want a solution of this question with all steps. Preferred by typing. Many thanks
Transcribed Image Text:Q9. The following table shows the marks of 40 students in chemistry mock exam. their teacher wants to
prepare a frequency distribution table using seven classes, further the teacher wants to know the average
mark for this group & the standard deviation.
13.26
32.43
18.10
58.23
64.00
68.20
35.35
33.92
23.94
18.28
22.05
39.14
31.43
18.51
21.03
5.50
6.96
5.19
28.66
26.29
13.89
25.87
9.84
26.88
16.81
38.65
19.23
21.82
31.58
30.13
42.42
16.51
21.16
32.97
9.84
10.64
29.56
40.69
12.86
13.80
Class
Frequency
F(
F(
5-14
10
9.5
95
902.5
15-24
11
19.5
214.5
380.25
4182.75
25-34
11
29.5
324.5
870.25
9572.75
35-44
5
39.5
197.5
1560.25
7801.25
45-54
49.5
2450.25
55-64
59.5
119
3540.25
7080.5
66-74
1
69.5
69.5
4830.25
4830.25
Total
40
1020
13721.75
34370
2.
Expert Solution
This question has been solved!
Explore an expertly crafted, step-by-step solution for a thorough understanding of key concepts.

Step by step
Solved in 2 steps

Knowledge Booster


Learn more about
Need a deep-dive on the concept behind this application? Look no further. Learn more about this topic, statistics and related others by exploring similar questions and additional content below.Recommended textbooks for you
Glencoe Algebra 1, Student Edition, 9780079039897…
Algebra
ISBN:
9780079039897
Author:
Carter
Publisher:
McGraw Hill
Glencoe Algebra 1, Student Edition, 9780079039897…
Algebra
ISBN:
9780079039897
Author:
Carter
Publisher:
McGraw Hill