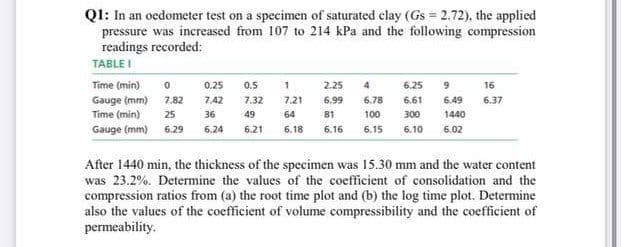
QI: In an oedometer test on a specimen of saturated clay (Gs = 2.72), the applied pressure was increased from 107 to 214 kPa and the following compression readings recorded: TABLE I Time (min) o 0.25 0.5 2.25 4 6.25 9 16 Gauge (mm) 7.82 742 7.32 721 Time (min) 6.99 6.78 6.61 6.49 637 25 36 49 100 64 81 300 1440 Gauge (mm) 629 6.24 6.21 6.18 6.16 6.15 6.10 6.02 After 1440 min, the thickness of the specimen was 15.30 mm and the water content was 23.2%. Detemine the values of the coefficient of consolidation and the compression ratios from (a) the root time plot and (b) the log time plot. Determine also the values of the coefficient of volume compressibility and the coefficient of permeability.
QI: In an oedometer test on a specimen of saturated clay (Gs = 2.72), the applied pressure was increased from 107 to 214 kPa and the following compression readings recorded: TABLE I Time (min) o 0.25 0.5 2.25 4 6.25 9 16 Gauge (mm) 7.82 742 7.32 721 Time (min) 6.99 6.78 6.61 6.49 637 25 36 49 100 64 81 300 1440 Gauge (mm) 629 6.24 6.21 6.18 6.16 6.15 6.10 6.02 After 1440 min, the thickness of the specimen was 15.30 mm and the water content was 23.2%. Detemine the values of the coefficient of consolidation and the compression ratios from (a) the root time plot and (b) the log time plot. Determine also the values of the coefficient of volume compressibility and the coefficient of permeability.

Principles of Foundation Engineering (MindTap Course List)
9th Edition
ISBN:9781337705028
Author:Braja M. Das, Nagaratnam Sivakugan
Publisher:Braja M. Das, Nagaratnam Sivakugan
Chapter3: Natural Soil Deposits And Subsoil Exploration
Section: Chapter Questions
Problem 3.17P

Related questions

Question
Q: I an oedometer test on a specimen of saturated clay (Gs = 2.72), the applied pressure was increased from 107 1o 214 kPa and the following compression readings recorded: TaBLE| Tmen 0 025 05 1 225 4 &5 9 16 Guugelmm) 78 742 732 721 6% 678 &6 643 637 Teme(mi) 25 % 4 s om0 X0 a0 Guge(nm) 629 626 621 618 616 615 610 602 After 1440 min, the thickness of the specimen was 15.30 mm and the water content was 23.2%. Determine the values of the coefficient of consolidation and the compression atios from (a) the root time plot and (b) the log time plot. Determine also the values of the coefTicient of volume compressibility and the coefficient of permeability.
Transcribed Image Text:Q1: In an oedometer test on a specimen of saturated clay (Gs = 2.72), the applied
pressure was increased from 107 to 214 kPa and the following compression
readings recorded:
TABLE I
Time (min)
0.25
0.5
2.25
4
6.25
9.
16
Gauge (mm)
Time (min)
7.82
7.42
7.32
7.21
6.99
6.78
6.61
6.49
6.37
25
36
49
64
81
100
300
1440
Gauge (mm) 6.29
6.24
6.21
6.18
6.16
6.15
6.10
6.02
After 1440 min, the thickness of the specimen was 15.30 mm and the water content
was 23.2%. Determine the values of the coefficient of consolidation and the
compression ratios from (a) the root time plot and (b) the log time plot. Determine
also the values of the coefficient of volume compressibility and the coefficient of
permeability.
Expert Solution
This question has been solved!
Explore an expertly crafted, step-by-step solution for a thorough understanding of key concepts.

Step by step
Solved in 2 steps with 5 images

Knowledge Booster


Learn more about
Need a deep-dive on the concept behind this application? Look no further. Learn more about this topic, civil-engineering and related others by exploring similar questions and additional content below.Recommended textbooks for you
Principles of Foundation Engineering (MindTap Cou…
Civil Engineering
ISBN:
9781337705028
Author:
Braja M. Das, Nagaratnam Sivakugan
Publisher:
Cengage Learning
Principles of Foundation Engineering (MindTap Cou…
Civil Engineering
ISBN:
9781337705028
Author:
Braja M. Das, Nagaratnam Sivakugan
Publisher:
Cengage Learning