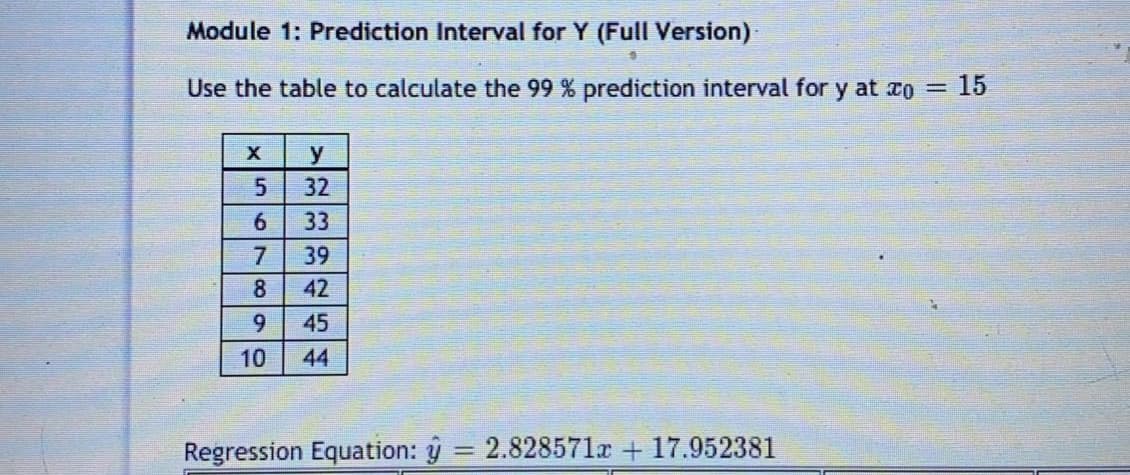
Module 1: Prediction Interval for Y (Full Version) Use the table to calculate the 99 % prediction interval for y at zo 15 y 5 32 6 33 7 39 8. 42 9 45 10 44 Regression Equation: ý = 2.828571r + 17.952381 %3D


Q: The regression line ?̂?=4+1.6?? has been fitted to the data points (x, y):
A: Excel Procedure: Enter X and Y in Excel>Data>Data Analysis> ‘Regression’>Select Y under…
Q: Get scatter plot of y vs x. Explain their statistical relation. Based on the plot write a tentative…
A: Hello thanks for your question. Since you have posted a question with multiple sub-parts, we will…
Q: I. R^2 is the square of correlation coefficient I. The type II error of a test is the probability of…
A:
Q: An econometrician suspects that the residuals of her model might be autocorrelated. Explain the…
A: Note: Hey, since there are multiple questions posted, we will answer first question. If you want any…
Q: In two or more complete sentences, formulate how to use technology to calculate the appropriate…
A: solnGiven:- How to use technology to calculate the appropriate regression modelfor data.Given…
Q: he professor collects data from 65 randomly chosen students. The estimated OLS regression is: Y = 45…
A: B option is correct as we want to check that, there is any significant effect of x on y or not. So…
Q: Applying the Concepts and SkillsIn Exercises, we repeat the information from Exercises. For each…
A:
Q: Scores x on the SAT Writing among Kentucky high school seniors in a recent year were normally…
A: For independent variable X and dependent variable Y, the slope is defined as b = r(sy/sx), where r…
Q: Explain how to predict y-values using the equation of a regression line. Choose the correct answer…
A:
Q: type of information provided by these plots. e. Compute the studentized residuals and the R-student…
A: Since you have asked multiple questions, we will solve the first question for you. If you want any…
Q: Construct the indication prediction interval for an individual y. The equation of the regression…
A: Confidence interval for the mean value of y, given x = xp : y^ ± tα/2, n-2 se1+1n+(xp-x¯ )2∑(xi-x¯)2…
Q: This assignment involves putting together a scenario where you are asking a question that requires…
A: Given that, This assignment involves putting together a scenario where you are asking a question…
Q: Linear Regression and Correlation. X y 1 1.56 2.92 3 1.38 4 -6.66 5 3.3 6 -4.04 Compute the equation…
A: Solution-: We have following data: X Y 1 1.56 2 2.92 3 1.38 4 -6.66 5 3.3 6 -0.04…
Q: Linear Regression and Correlation. y 1 1.8 2.3 5.9 -7.5 5 -7.3 6 -3.2 Compute the equation of the…
A: The independent variable is x. The dependent variable is y. The given data represents simple linear…
Q: Temp. 173 175 176 177 177 178 179 180 Ratio 0.76 1.23 1.44 0.95 1.01 1.02 1.10 1.84 Temp. 183 183…
A:
Q: A regression equation yˆ = 577 − 3.01x for the relationship between y = the maximum distance at…
A: Given a regression equation and we have to find the answer of related question
Q: Bivariate data obtained for the paired variables x and y are shown below, in the table labelled…
A: Given information
Q: (f) The econometrician follows your guidance in part (b) and calculates a value for the…
A: Solution : Give that : d = 0.95 n = 60 k = 3
Q: A researcher interested in explaining the level of foreign reserves for the country of Barbados…
A: Consider a regression model for the prediction of yearly foreign reserves with three predictors:…
Q: Consider the forecasting model with a simple, linear trend: It = B1 + B2t + Et Where t is the index…
A:
Q: Required: i. Write the estimated regression equation for the full model with all three (3)…
A: As per our guidelines, we will only answer first question, please repost other questions for more…
Q: (a) Develop an estimated regression equation using trede price and speed of execution to predict the…
A: Note that according to answering guidelines I can only answer 3 parts of the question. I used R…
Q: I converted sugar obtained in a certain process at various temperatures. Assume a linear…
A: A simple linear regression equation uses a straight line to relate the explanatory and response…
Q: (a) Write down the simple linear regression model with necessary explanation of each term. (b)…
A: Q1. a. Simple linear regression model: The simple linear regression model is y=a+bx where, y- the…
Q: IIIst teSt. THe JoUenba uares regression line was = 10 + 0.9x ere represents the predicted final…
A: Given regression equation isy=10+0.9x
Q: The model y = 5x – 2 approximates the data (1, 1), (3, 11), (6, 29). Complete the table, and find…
A: Obtain the value of SSE
Q: the regression line for the data points. x y 1 2 2 5 3 9 4 11 y' =
A: Solution:Straight line equation is y=a+bx.The normal equations are∑y=an+b∑x∑xy=a∑x+b∑x2The values…
Q: Linear Regression and Correlation. y 1 -0.78 0.04 8.26 4 0.98 6.6 3.02 Compute the equation of the…
A: We have given that data I want to find regression equation and correlation coefficients.
Q: State Debt and Per Capita Taxes Data for per capita state debt and per capita state tax for five…
A: From the given data we find correlation coefficient and regression analysis.
Q: The data show the bug chirps per minute at different temperatures. Find the regression equation,…
A: Given, Chirps in 1 min Temperature(° F) 1216 87.4 984 81.8 1173 90.8 914 72.5 1081 86.9…
Q: This assignment involves putting together a scenario where you are asking a question that requires…
A: Given problem is : This assignment involves putting together a scenario where you are asking a…
Q: 2. You are interested in finding out the linear regression fit of 2 sets of variables. You already…
A: Given that, x=42.5, sx=14.9,y=67.3, sy=28.0 , r=0.6552. The linear regression of Y on X is given by,…
Q: Depth of snow (m) Number of skiers 0.5 120 0.8 250 2.1 500 3.6 780 1.4 300 1.5 280 1.8 410 2.7 320…
A: Introduction - Line of best fit Line of best fit refers to a line through a scatter plot of data…
Q: of time as the soil dries out. The researcher hypothesized a decreasing trend, possibly linear, in…
A: Given data:
Q: i. Specify the regression model. ii. Interpret the result of the estimated coefficients of this…
A: a) Here, y=salary, x1=years of experience, x2=years of postsecondary education. From the output, the…
Q: Alumni Contributions The director of an alumni association for a small college wants to determine…
A: The independent variable is Years. The dependent variable is Contribution. We have to find the…
Q: 11) A simple linear regression model based on 20 observations. The F-stat for the model is 21.44 and…
A: Solution : a)completing the given table: source SS df MS F regression 1.68 1 1.679 21.4400…
Q: Bivariate data obtained for the paired variables x and y are shown below, in the table labelled…
A:
Q: 1. Sales, in millions of pesos, of a certain company are shown here. Year (X) |Sales (Y) 2 3 4 6 10…
A: y^ = b0 + b1 *xy^ = 12.2669 +1.2242 *x bo = intercept b1 = slope b1=∑x*y -n*x¯*y¯ ∑ixi2 -n*x¯2…
Q: 2. Consider the regression model given by: B1B2X2i+B3X3i +B4X4i+ B5X5i + Ui Y (a) Suppose that a…
A: (i).The null and alternative hypotheses to test the significance of subset of regression…
Q: Calculate the sum of the products and the sum of squares for X. SP = and SSXX = . Find…
A: Given. Scores Patient Fatigue (X) Depression (Y) A 9 1.75 B 7 6.75 C 5 8 D 3 5.25…
Q: 1. Simple Linear Regression Estimation: (a) For the model y; = B1 + B2x; + Ui, define the fitted…
A: Given information: Note: As per guidelines we will only answer the first three subparts, please…
Q: a. Develop the least square regression equation for these variables. Plot the regression line on the…
A: The independent variable is Advertising. The dependent variable is Weekly Sales. This is simple…
Q: Amount of brake fluid can affect the breaking time of a vehicle. Engineer Nsiah conducts an…
A: For ease of calculations we construct the following table: x y x- x_bar y-y_bar (x-x_bar)^2…
Q: The data show the chest size and weight of several bears. Find the regression equation, letting…
A: Software procedure for regression in EXCEL. Enter the given data in EXCEL sheet. Go to Data >…
Q: A Compute the value of the correlation coefficient between x and y. I.e., compute r. В. Find the…
A: Given that Number of observations, n = 250 X denotes midterm grades, and Y denotes final grades.
Q: In this section we introduced a descriptive measure of the utility of the multiple linear regression…
A: The descriptive measure that is used to access the utility of the multiple linear regressions for…
Q: In this section, we introduced a descriptive measure of the utility of the regression equation for…
A:
Q: ul Sprint 11:43 AM 86% Done Attachment 11 Construct the indicated prediction interval for an…
A:
Q: Understanding the Concepts and Skills For two variables satisfying Assumptions 1–3 for regression…
A: The slope of the sample regression line is normally distribute with the mean of the slope of the…

Round the following to 3 decimal places
Margin of Error E =
The 99% prediction interval for the value of y at x0=15 is between

Step by step
Solved in 4 steps


- Incidence rate in the last influenza epidemic was found to be 50 per thousand (5%) of the population exposed. What should be the size of sample to find incidence rate in the current epidemic if allowable error is 0.005 and 0.01?A study was done to compare the birth weight of newborn babies from the general population to a group of 24 babies born to mothers who smoked during pregnancy. The researcher was testing her prediction of an average lower birth weight for babies born to smokers. The mean birth weight in the population was reported to be 3.5 kg and birth weight in the sample was M = 3.0 kg. Results from the t-test used in data analysis showed a t-value = 5.35, p = .02. No calculations are required here. Type in your answers to the following questions in the space below. 1) which of the 3 t-tests is the proper one to use? 2) Write the Null and Alternative Hypotheses for this study in a sentence, including the value of mu. 3) Write an APA conclusion for this study to report the results. This sentence should include the IV and DV, significance, APA stats, and the M.Experience of Taxi Drivers A taxi company claims that its drivers have an average of at least 12.4 years’ experience. In a study of 15 taxi drivers, the average experience was 11.2 years. The standard deviation was 2. At alpha = 0.10, is the number of years’ experience of the taxi drivers really less than the taxi company claimed? Please show how to solve using the formulas, thanks!
- a) Write the model equation (in terms of Y's, X's and parameters) that describes the parallel lines fit to the data in the graph. Make sure to define the terms clearly. and any assumptions for the model are clearly stateted. b) A Working-Hotelling Prediction interval for the mutual fund type at size =120 is (18,20). Interprete this interval. Then assess whether this would be more useful to a company of this size than the corresponding CI for the mean response.The quality department at ElectroTech is examining which of two microscope brands (Brand A or Brand B) to purchase. They have hired someone to inspect six circuit boards using both microscopes. Below result in terms of a number of defects (e.g., solder voids, misaligned components) found using each microscope. (Note that the data for two brands can be paired) State all the assumptions required to define the test statistic. State the test Statistic in notations first and then calculate its value Find the p-value Carry out test of hypotheses at 1% level of significance and state the conclusion in context of problem. Calculate 99% confidence interval for the true average difference in defects found for two microscope brands.MLE- Maximum Likelyhood estimator MME - Method of Moments estimator
- 1. Let μ denote the true average level of radioactivity of the water in a nuclear plant. Five (5) picocuries per liter is considered the dividing line between safe and unsafe water. a. State the null and alternate hypothesis you would test if you worked at the plant andexplain why you chose your alternate hypothesis.b. In the context of this situation, describe what happens if there is a type I error and type II error.The Specific Absorption Rate (SAR) for a cell phone measures the amount of radio frequency (RF) energy absorbed by the user's body when using the handset. Every cell phone emits RF energy. Different phone models have different SAR measures. To receive certification from the Federal Communications Commission (FCC) for sale in the United States, the SAR level for a cell phone must be no more than 1.5 watts per kilogram. A sample of 47 models was tested and the average of their Specific Absorption Rates (SARs) was found to be 1.18 watts per kilogram. Assume that the population standard deviation is 0.25 watts per kilogram. Construct a 90% confidence interval for the mean of the SARs for cell phones that received certification from FCC. Margin of error (if applicable): (Round the answer to 2 decimal places)The Specific Absorption Rate (SAR) for a cell phone measures the amount of radio frequency (RF) energy absorbed by the user's body when using the handset. Every cell phone emits RF energy. Different phone models have different SAR measures. To receive certification from the Federal Communications Commission (FCC) for sale in the United States, the SAR level for a cell phone must be no more than 1.5 watts per kilogram. A sample of 47 models was tested and the average of their Specific Absorption Rates (SARs) was found to be 1.18 watts per kilogram. Assume that the population standard deviation is 0.25 watts per kilogram. Construct a 90% confidence interval for the mean of the SARs for cell phones that received certification from FCC. Confidence interval:( , ) Interpretation: We are % confident that the mean of the SARs for cell phones that received certification from FCC is between watts per kilogram and watts per kilogram.
- The Specific Absorption Rate (SAR) for a cell phone measures the amount of radio frequency (RF) energy absorbed by the user's body when using the handset. Every cell phone emits RF energy. Different phone models have different SAR measures. To receive certification from the Federal Communications Commission (FCC) for sale in the United States, the SAR level for a cell phone must be no more than 1.5 watts per kilogram. A sample of 47 models was tested and the average of their Specific Absorption Rates (SARs) was found to be 1.18 watts per kilogram. Assume that the population standard deviation is 0.25 watts per kilogram. Construct a 90% confidence interval for the mean of the SARs for cell phones that received certification from FCC. Point estimate: =watts per kilogram (Round the answer to 2 decimal places) Confidence level % and �= , also �2= , and 1-�2= Critical values: (Round the answer to 2 decimal places) left= right=CONFLICT RESOLUTION 2 of 4 What is the critical z/t score at α = 0.05? The Center for the Study of Violence wants to determine whether conflict-resolution program in a particular high school reduces aggressive behavior among its students. For 8 students, aggression was measured both before and after they participated in the conflict resolution course. What is the critical z/t score at α = 0.05? Their scores are below:The daily dissolved oxygen concentration in a downstream from an industrial plant has been recorded for the past 10 days (see image). Suppose the minimum concentration required by the EPA is 2.0 mg/L. Perform a hypothesis test to determine whether the stream quality satisfies the EPA standard at the significance level of 5%. Indicate the parameters of interest, null and alternative hypotheses, and test statistic (with complete computations). What can you conclude? (Can the null hypothesis be rejected or not?)