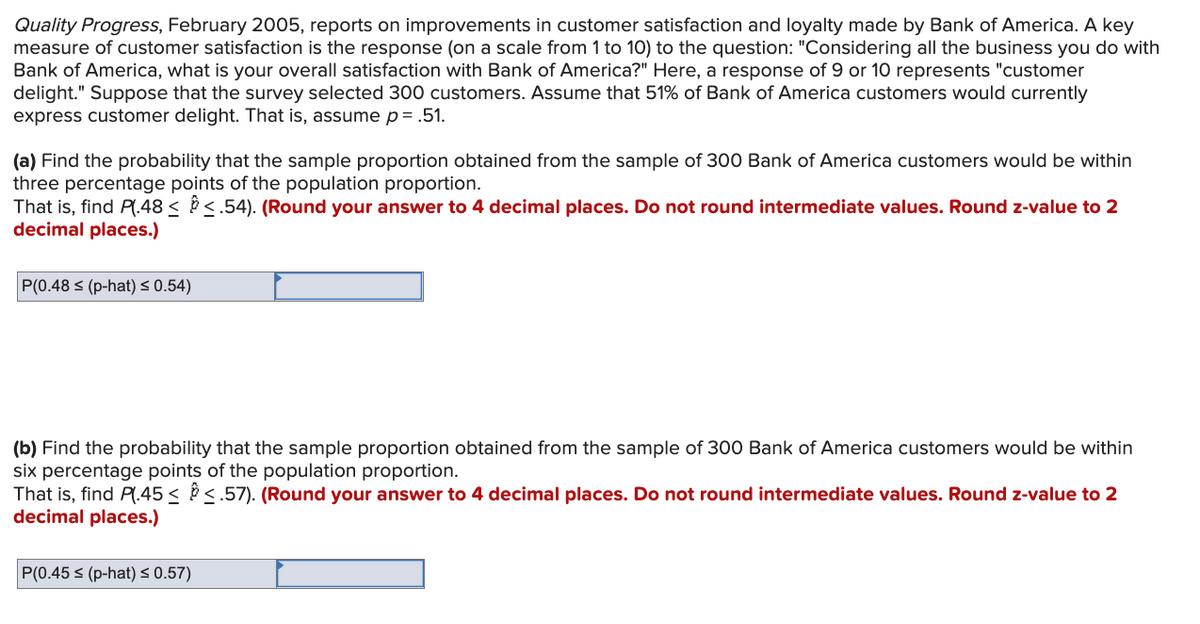
Quality Progress, February 2005, reports on improvements in customer satisfaction and loyalty made by Bank of America. A key measure of customer satisfaction is the response (on a scale from 1 to 10) to the question: "Considering all the business you do with Bank of America, what is your overall satisfaction with Bank of America?" Here, a response of 9 or 10 represents "customer delight." Suppose that the survey selected 300 customers. Assume that 51% of Bank of America customers would currently express customer delight. That is, assume p = .51. (a) Find the probability that the sample proportion obtained from the sample of 300 Bank of America customers would be within three percentage points of the population proportion. That is, find Pl.48 <<.54). (Round your answer to 4 decimal places. Do not round intermediate values. Round z-value to 2 decimal places.) P(0.48 ≤ (p-hat) ≤ 0.54) (b) Find the probability that the sample proportion obtained from the sample of 300 Bank of America customers would be within six percentage points of the population proportion. That is, find P(.45 <<.57). (Round your answer to 4 decimal places. Do not round intermediate values. Round z-value to 2 decimal places.) P(0.45 ≤ (p-hat) ≤ 0.57)
Quality Progress, February 2005, reports on improvements in customer satisfaction and loyalty made by Bank of America. A key measure of customer satisfaction is the response (on a scale from 1 to 10) to the question: "Considering all the business you do with Bank of America, what is your overall satisfaction with Bank of America?" Here, a response of 9 or 10 represents "customer delight." Suppose that the survey selected 300 customers. Assume that 51% of Bank of America customers would currently express customer delight. That is, assume p = .51. (a) Find the probability that the sample proportion obtained from the sample of 300 Bank of America customers would be within three percentage points of the population proportion. That is, find Pl.48 <<.54). (Round your answer to 4 decimal places. Do not round intermediate values. Round z-value to 2 decimal places.) P(0.48 ≤ (p-hat) ≤ 0.54) (b) Find the probability that the sample proportion obtained from the sample of 300 Bank of America customers would be within six percentage points of the population proportion. That is, find P(.45 <<.57). (Round your answer to 4 decimal places. Do not round intermediate values. Round z-value to 2 decimal places.) P(0.45 ≤ (p-hat) ≤ 0.57)

MATLAB: An Introduction with Applications
6th Edition
ISBN:9781119256830
Author:Amos Gilat
Publisher:Amos Gilat
Chapter1: Starting With Matlab
Section: Chapter Questions
Problem 1P

Related questions
Question
Transcribed Image Text:Quality Progress, February 2005, reports on improvements in customer satisfaction and loyalty made by Bank of America. A key
measure of customer satisfaction is the response (on a scale from 1 to 10) to the question: "Considering all the business you do with
Bank of America, what is your overall satisfaction with Bank of America?" Here, a response of 9 or 10 represents "customer
delight." Suppose that the survey selected 300 customers. Assume that 51% of Bank of America customers would currently
express customer delight. That is, assume p= .51.
(a) Find the probability that the sample proportion obtained from the sample of 300 Bank of America customers would be within
three percentage points of the population proportion.
That is, find Pl.48< <.54). (Round your answer to 4 decimal places. Do not round intermediate values. Round z-value to 2
decimal places.)
P(0.48 ≤ (p-hat) ≤ 0.54)
(b) Find the probability that the sample proportion obtained from the sample of 300 Bank of America customers would be within
six percentage points of the population proportion.
That is, find P(.45≤ ≤.57). (Round your answer to 4 decimal places. Do not round intermediate values. Round z-value to 2
decimal places.)
P(0.45 ≤ (p-hat) ≤ 0.57)
Expert Solution
This question has been solved!
Explore an expertly crafted, step-by-step solution for a thorough understanding of key concepts.

This is a popular solution!

Trending now
This is a popular solution!

Step by step
Solved in 3 steps with 4 images

Recommended textbooks for you
MATLAB: An Introduction with Applications
Statistics
ISBN:
9781119256830
Author:
Amos Gilat
Publisher:
John Wiley & Sons Inc

Probability and Statistics for Engineering and th…
Statistics
ISBN:
9781305251809
Author:
Jay L. Devore
Publisher:
Cengage Learning

Statistics for The Behavioral Sciences (MindTap C…
Statistics
ISBN:
9781305504912
Author:
Frederick J Gravetter, Larry B. Wallnau
Publisher:
Cengage Learning
MATLAB: An Introduction with Applications
Statistics
ISBN:
9781119256830
Author:
Amos Gilat
Publisher:
John Wiley & Sons Inc
Probability and Statistics for Engineering and th…
Statistics
ISBN:
9781305251809
Author:
Jay L. Devore
Publisher:
Cengage Learning
Statistics for The Behavioral Sciences (MindTap C…
Statistics
ISBN:
9781305504912
Author:
Frederick J Gravetter, Larry B. Wallnau
Publisher:
Cengage Learning

Elementary Statistics: Picturing the World (7th E…
Statistics
ISBN:
9780134683416
Author:
Ron Larson, Betsy Farber
Publisher:
PEARSON

The Basic Practice of Statistics
Statistics
ISBN:
9781319042578
Author:
David S. Moore, William I. Notz, Michael A. Fligner
Publisher:
W. H. Freeman

Introduction to the Practice of Statistics
Statistics
ISBN:
9781319013387
Author:
David S. Moore, George P. McCabe, Bruce A. Craig
Publisher:
W. H. Freeman