QUANTITY (Dinners out per month) 20 18 16 14 0 1 O 2 3 4 5 6 8 INCOME (Thousands of dollars per month) 9 10 0 Nick Hint: When answering the following, be sure to specify the appropriate units. The blue point already shown on the graph shows the data for Rosa. According to the graph, Rosa's income is Use the orange point (square symbol) to plot the data for Nick. Suppose Rosa's friend Nick has an income of $6,000 per month and has 12 dinners out per month. , and she has
QUANTITY (Dinners out per month) 20 18 16 14 0 1 O 2 3 4 5 6 8 INCOME (Thousands of dollars per month) 9 10 0 Nick Hint: When answering the following, be sure to specify the appropriate units. The blue point already shown on the graph shows the data for Rosa. According to the graph, Rosa's income is Use the orange point (square symbol) to plot the data for Nick. Suppose Rosa's friend Nick has an income of $6,000 per month and has 12 dinners out per month. , and she has

Chapter18: Poverty And Redistribution
Section: Chapter Questions
Problem 1.1P

Related questions
Question
Transcribed Image Text:QUANTITY (Dinners out per month)
20
18
16
14
2
0
0
O
1 2 3 4 5
6
7
8
INCOME (Thousands of dollars per month)
9
10
☐
Nick
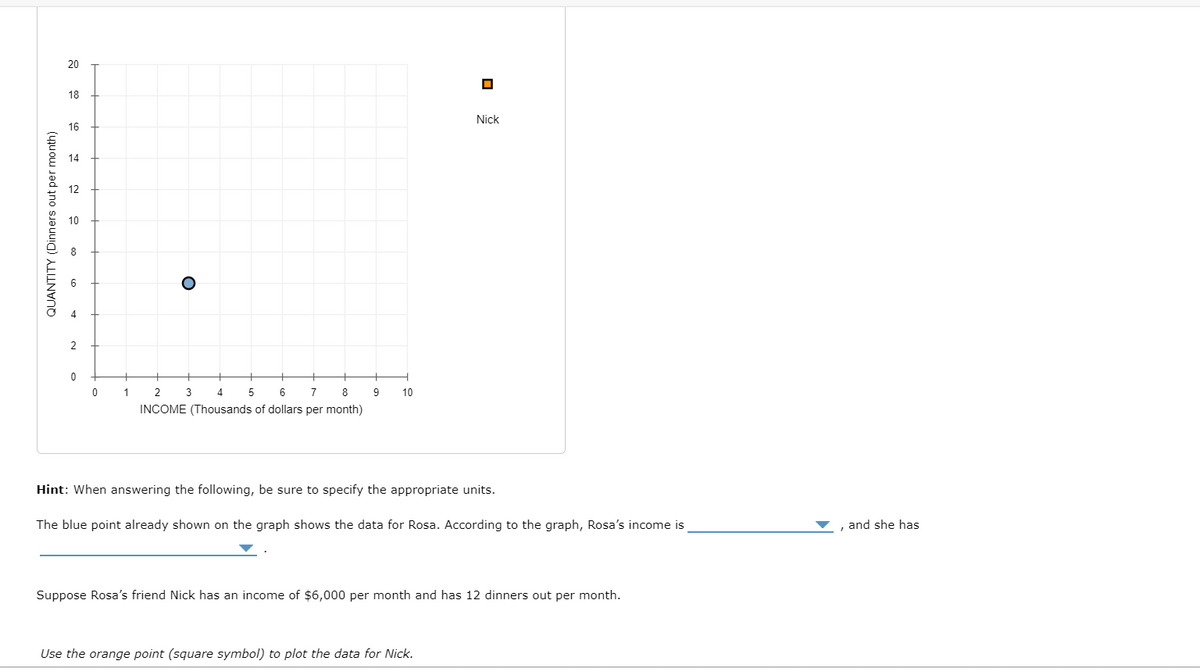
Hint: When answering the following, be sure to specify the appropriate units.
The blue point already shown on the graph shows the data for Rosa. According to the graph, Rosa's income is
Use the orange point (square symbol) to plot the data for Nick.
Suppose Rosa's friend Nick has an income of $6,000 per month and has 12 dinners out per month.
and she has
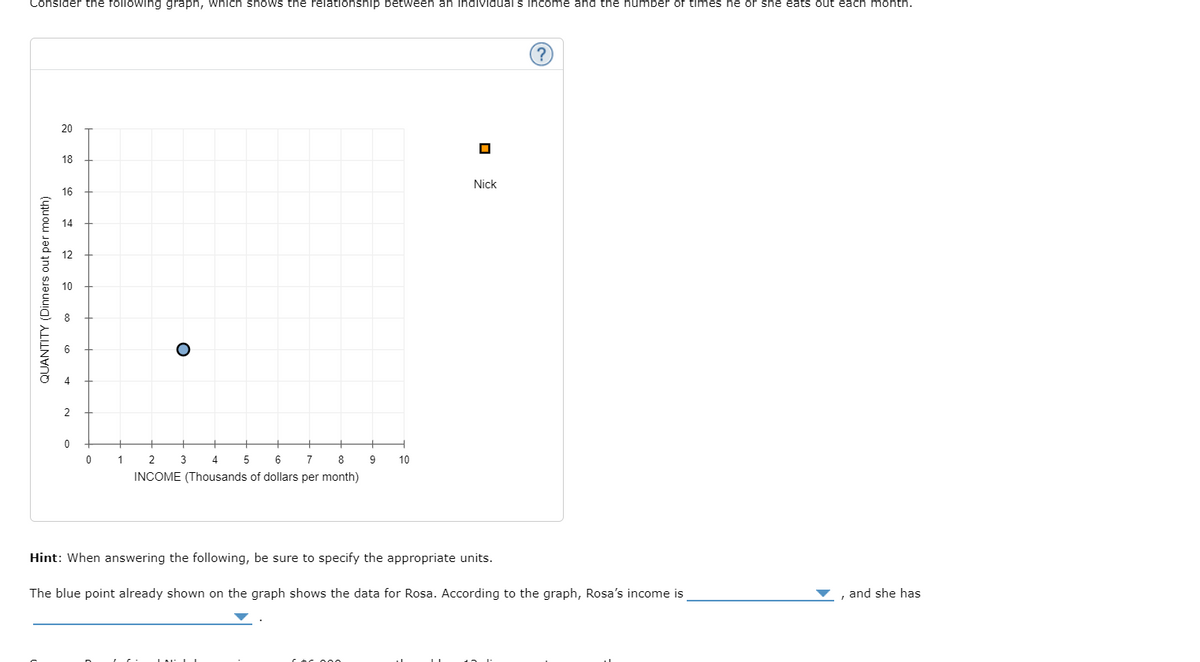
Transcribed Image Text:Consider the following graph, which shows the relationship between an individual's income and the number of times he or she eats out each month.
QUANTITY (Dinners out per month)
20
18
16
14
12
2
0
0
O
3
1 2
4
5
6
7
8
INCOME (Thousands of dollars per month)
9
10
☐
Nick
Hint: When answering the following, be sure to specify the appropriate units.
II
The blue point already shown on the graph shows the data for Rosa. According to the graph, Rosa's income is
and she has
Expert Solution
This question has been solved!
Explore an expertly crafted, step-by-step solution for a thorough understanding of key concepts.

This is a popular solution!

Trending now
This is a popular solution!

Step by step
Solved in 2 steps with 1 images

Knowledge Booster


Learn more about
Need a deep-dive on the concept behind this application? Look no further. Learn more about this topic, economics and related others by exploring similar questions and additional content below.Recommended textbooks for you


Principles of Economics 2e
Economics
ISBN:
9781947172364
Author:
Steven A. Greenlaw; David Shapiro
Publisher:
OpenStax