Question 1 The lifetimes (in units of 106 seconds) of certain satellite components are shown in the frequency distribution given in 'Datasetl'. 1. Draw a frequency polygon, histogram and cumulative frequency polygon for the data.
Question 1 The lifetimes (in units of 106 seconds) of certain satellite components are shown in the frequency distribution given in 'Datasetl'. 1. Draw a frequency polygon, histogram and cumulative frequency polygon for the data.

Holt Mcdougal Larson Pre-algebra: Student Edition 2012
1st Edition
ISBN:9780547587776
Author:HOLT MCDOUGAL
Publisher:HOLT MCDOUGAL
Chapter11: Data Analysis And Probability
Section11.2: Box-and-whisker Plots
Problem 1E

Related questions
Question
Transcribed Image Text:Dater
Jage Layout
Formulas
Data
Calibri
11
A A"
Paste
BIU 1 A-
pboard
Font
A.
B
D.
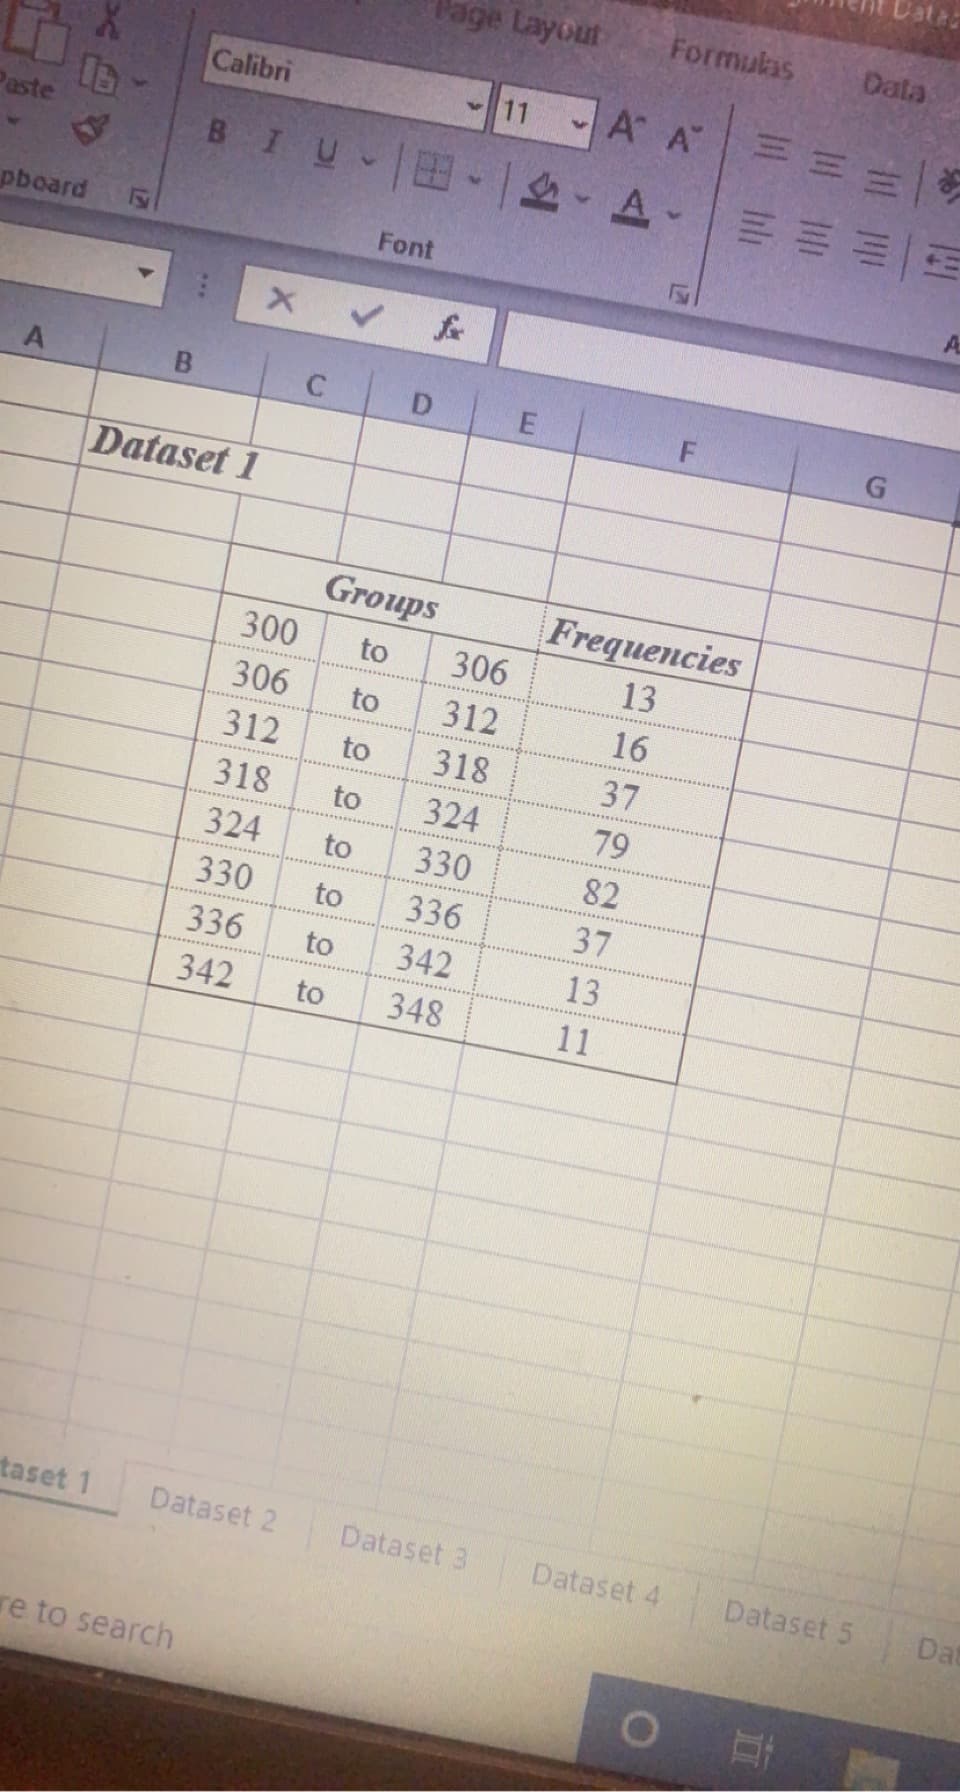
Dataset 1
Groups
Frequencies
300
to
306
13
306
to
312
16
312
to
318
37
318
to
324
79
324
to
330
82
330
to
336
37
336
to
342
13
342
348
11
taset 1
Dataset 2
Dataset 3
Dataset 4
Dataset 5
Dat
re to search
to
A..
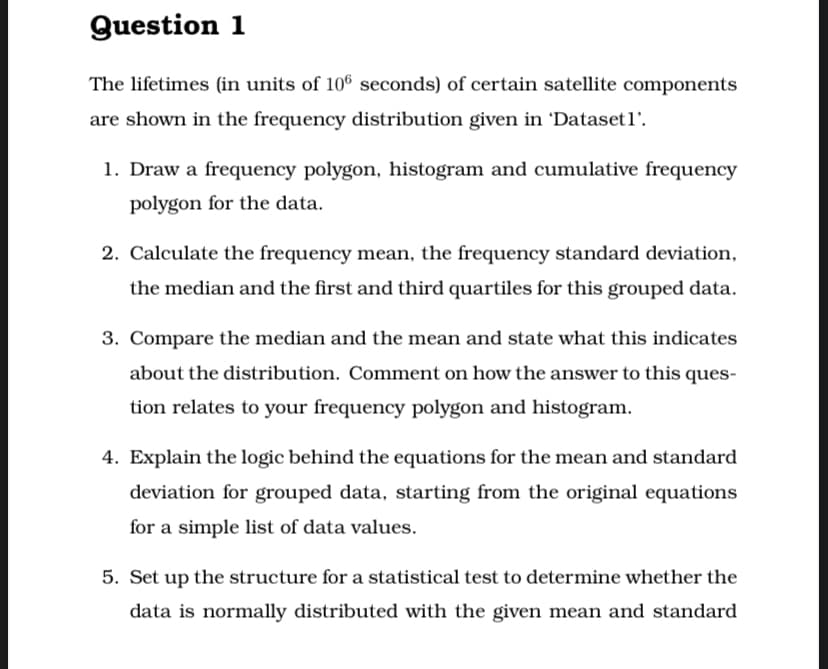
Transcribed Image Text:Question 1
The lifetimes (in units of 106 seconds) of certain satellite components
are shown in the frequency distribution given in 'Datasetl'.
1. Draw a frequency polygon, histogram and cumulative frequency
polygon for the data.
2. Calculate the frequency mean, the frequency standard deviation,
the median and the first and third quartiles for this grouped data.
3. Compare the median and the mean and state what this indicates
about the distribution. Comment on how the answer to this ques-
tion relates to your frequency polygon and histogram.
4. Explain the logic behind the equations for the mean and standard
deviation for grouped data, starting from the original equations
for a simple list of data values.
5. Set up the structure for a statistical test to determine whether the
data is normally distributed with the given mean and standard
Expert Solution
This question has been solved!
Explore an expertly crafted, step-by-step solution for a thorough understanding of key concepts.

Step by step
Solved in 3 steps with 3 images

Knowledge Booster


Learn more about
Need a deep-dive on the concept behind this application? Look no further. Learn more about this topic, statistics and related others by exploring similar questions and additional content below.Recommended textbooks for you
Holt Mcdougal Larson Pre-algebra: Student Edition…
Algebra
ISBN:
9780547587776
Author:
HOLT MCDOUGAL
Publisher:
HOLT MCDOUGAL

Glencoe Algebra 1, Student Edition, 9780079039897…
Algebra
ISBN:
9780079039897
Author:
Carter
Publisher:
McGraw Hill
Holt Mcdougal Larson Pre-algebra: Student Edition…
Algebra
ISBN:
9780547587776
Author:
HOLT MCDOUGAL
Publisher:
HOLT MCDOUGAL
Glencoe Algebra 1, Student Edition, 9780079039897…
Algebra
ISBN:
9780079039897
Author:
Carter
Publisher:
McGraw Hill