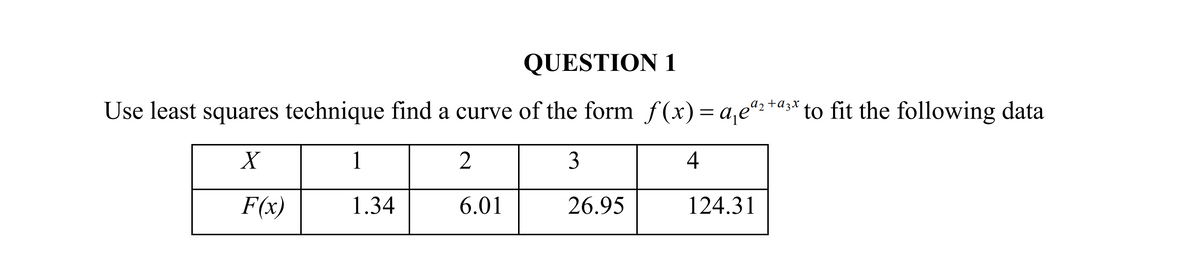
QUESTION 1 Use least squares technique find a curve of the form f(x)= a,e“: *a3* to fit the following data 1 2 3 4 F(x) 1.34 6.01 26.95 124.31


Q: Identify if the sentence is population or sample: 1. Score of all students in a math class 2. Numb...
A: The Population is the entire set of items from which you draw data for a statistical study. or Popul...
Q: Given the data, create a stem and leaf plot. Using the stem and leaf plot solve for the mean and med...
A: Given that The data are X=12,13,21,27,33,34,35,37,40,40,41,56
Q: A warehouse distributor of carpet keeps 6,000 yards of deluxe shag carpet in stock during a month. T...
A: B - In stock = 6000 =x Average demand = 4500 Standard deviation = 900 We know Z= (x-average) /standa...
Q: Compute the least-squares regression equation for the given data set. Use a TI-84 calculator. Round ...
A:
Q: The larger the interquartile range is in a data set, the more variable the data set is. O True O Fal...
A: We have given that statement: The large the Interquartile range is in a data set, the more variable ...
Q: A company produces steel rods. The lengths of the steel rods are normally distributed with a mean of...
A:
Q: Government funding: The following table presents the budget (in millions of dollars) for selected or...
A:
Q: The following model allows the return to education to depend upon the total amount o both parents' e...
A: From the given information, logwage=β0+β1educ+β2educ.pareduc+β3exper+β4tenure+u a) Let us consider t...
Q: The Mean and Standard Deviation of a series of 100 items were found to be 60 and 10 respectively. Wh...
A: Given that, The Mean and Standard Deviation of a series of 100 items were found to be 60 and 10 resp...
Q: The following are the prices of commodities in 2016 and 2017. Calculate a price index based on price...
A: Given that
Q: The statement" If Django Bustamante beat Bata Reyes in the first game, then he will have an even cha...
A:
Q: Which of these best represents the sample space associated with selecting two coins at random with r...
A: Given problem Given that Given, A bag contains, 2 dimes 1 nickel 1 penny Selecting two coins at ...
Q: Region Area 0.10 В 0.30 C 0.45 B C 0.15 0 1 2 3 4 6. 8 9 10 11 Use the figure and the table to answe...
A: The probability distribution function gives the probability at each possible value of a continuous r...
Q: Suppose IQ scores are approximately normally distributed with a mean of 100 and a standard deviation...
A: From the provided information, Mean (µ) = 100 Standard deviation (σ) = 15 X~N (100, 15) Here X be a ...
Q: The average heating bill of a random sample of 6 one-bedroom apartments in Prince George last winter...
A: Let n be the sample size X̄ be the sample mean s sample standard deviation
Q: A mayor running for re-election claims that during his term, average municipal taxes have fallen by ...
A: Given that Data : 309, 273, 283, 264, 304, 329, 290, 250, 269, 247, 331, 289, 286, 260, 238, 221, 2...
Q: Find the minimum sufficient statistic in the following situations. In order to establish minimality,...
A:
Q: Members of the board of directors of an association are voting to select a city to host their annual...
A: From the above data set we calculate Borda count for each City. Borda count for City L = (1*11)+(3*...
Q: A university is made up of five colleges: Arts and Sciences, Engineering, Business, Education, and V...
A: Total 198 scooter rental station Standard divisor = 55.09
Q: 3. Determine the number of possible samples of size 3 Show your solutions here.
A: Note: Hi, thank you for the question. As per our company guideline we are supposed to answer only fi...
Q: A tablet, a yo-yo, and a box of chocolates will be given to 3 randomly picked people out of 25 who a...
A:
Q: Suppose that the pairwise comparison method is used on the following preference table. If A, C, and ...
A: Here given no. of votes according to choice, we have to select the winner by pairwise comparison.
Q: Find the Mean, Median and Mode of the ff: 12, 8, 5, 5, 3, 0, -4, -9, -21 89, 80, 78, 88, 85...
A:
Q: You're trying to find out how many students who graduate with accounting degrees from large universi...
A: Solution: First we understand the concept of population and sample. Population: The complete enamur...
Q: Two types of smudge pots were tested for use to protect orchards from frost. A grapefruit grower wan...
A: Given Xbar 1=602.5 S1=26.99 N1=10 Xbar2=671.2 S2=42.06 N2=10
Q: ELT(Let) the joint probabilty density function of two con random variable Y and X. Please do the l...
A:
Q: Using the DJIA data and exponential smoothing with trend adjustment, forecast the opening DJIA value...
A: Given Information: Consider the given data: YEAR DIJA 2013 13104 2012 12392 2011 11577 20...
Q: The following are the number of minutes used by 13 students in answering a particular problem in Sta...
A:
Q: Find the minimum sufficient statistic in the following situations. In order to establish minimality,...
A: Please note that as per our guidelines if multiple questions are posted we can answer the first ques...
Q: According to a recent census a city has a 25% Hispanic population. Three samples are drawn from this...
A: From the provided information, it is known that jury of 12 people was drawn and only 1 of them was H...
Q: Example 6. Calculate Semi-Inter-Quartile Range and the Co-efficient of Q.D. from the following data ...
A:
Q: A paint company has large outlet stores in two cities. Ten samples of the weekly sales (in tons) for...
A:
Q: Create an example of a between-subjects experiment. Briefly describe your experiment. Tell us what a...
A: It is theory base question
Q: Before 1918, approximately 60% of the wolves in a region were male, and 40% were female. However, ca...
A: For the given data using binomial distribution Find (a) Before 1918, in a random sample of 11 wolves...
Q: A of researchers are interested in differences in stress levels between nurse practitioners and phys...
A: For the given data perform t test for independent test
Q: An excavation company has been contracted to supply 10 million cubic feet (cu. ft.) of dirt to a con...
A: This is equivalent to an M/M/s queuing model with the following parameters: λ = average arrival rate...
Q: USA Today reports that about 25% of all prison parolees become repeat offenders. Alice is a social w...
A:
Q: Consider a binomial distribution with 8 trials. Either use SALT, or look at a binomial probability d...
A: Solution-: Consider a binomial distribution with 8 trials. (a) For what value of p is the distributi...
Q: Let pX(x) be the pmf of a random variable X. Find the cdf F(x) of X and sketch its graph along with...
A:
Q: The average score of boys is 60, that of girls is 70 and that of all the candidates is 64 appearing ...
A:
Q: Write your solutions Given: |U| = 35 |ANB|= 6 |ANBNC| = 2 |A| = 15 |ANC| = 6 |C| = 14 |B| = 15 |BNC|...
A:
Q: LO References Mailings Review View Help EndNote X9 12 三三三 Normal No Spacing Heading 1 A A b 3へ田 Para...
A: Given the data as professional skilled laborer unskilled laborer professional 80% 10% 10% ...
Q: If M = 237.83, S = 22.48, Mu = 195.66 and n = 16 what is the obtained value?
A:
Q: Find the z-scores that separate the middle 26% of the distribution from the area in the tails of the...
A:
Q: a) Draw a Pie-diagram and also a Component Bar-diagram for the following data: Item Expenditure in R...
A: INTRODUCTION: Pie- Diagram: Pie diagram is used to determine the data in the circular graph. It gi...
Q: 4. Find the probability of getting a numbered card when a card is drawn from the pack of 52 cards.
A: From a pack of 52 cards p( numbered card )=?
Q: a. At LUG, 30% of students are majoring in Business. i. In a sample of 10 LUG students, what is the ...
A: Given that, Probability, p= 0.30 (i). If sample size is, n= 10 Then X~Binomial(10,0.30) p.m.f o...
Q: people put standard deviation 7 mL. Suppose that 50 randomly selected people are observed pouring sy...
A:
Q: Suppose you wanted to decrease the margin of error on your Overall Website Satisfaction metric to 0....
A: Given 100 recent customers data and asked them to rate their satisfaction on a scale from 1-5 (5 bei...
Q: In conclusion, state the relationship between the mass of the spherical object and the distances the...
A: Keeping the distance relative to the ramp constant, it is observed that the knockback distance of ca...

Step by step
Solved in 2 steps with 2 images

- consider the regression model Yi = β0 + β1Xi +ui. suppose you know that β0 = 0. derive a formula for the least square estimator of β1You have collected data from a sample of a population. You want to use this sample to estimate a parameter of the population. To do this, you will use the methods of ___________________?The least-squares regression equation is y=620.6x+16,624 where y is the median income and x is the percentage of 25 years and older with at least a bachelor's degree in the region. The scatter diagram indicates a linear relation between the two variables with a correlation coefficient of 0.7004. Predict the median income of a region in which 30% of adults 25 years and older have at least a bachelor's degree.
- Which method gives a unique set of values to the constants in the equation of the fitting curves? * Newton's Method Interpolation Horner’s method Method of least squaresThe least-squares regression equation is y=620.6x+16,624 where y is the median income and x is the percentage of 25 years and older with at least a bachelor's degree in the region. The scatter diagram indicates a linear relation between the two variables with a correlation coefficient of 0.7004. In a particular region, 28.3 percent of adults 25 years and older have at least a bachelor's degree. The median income in this region is $37,389. Is this income higher than what you would expect? Why?Derive the normal equation for finding the least-squares linear fitthrough the origin y = Ax.
- The least-squares regression equation is y=647.8x+17,858 where y is the median income and x is the percentage of 25 years and older with at least a bachelor's degree in the region. The scatter diagram indicates a linear relation between the two variables with a correlation coefficient of 0.7507. predict the median income of a region in which 20% of adults 25 years and older have at least a bachelor's degree. Round to the nearest dollar as needed.Researchers in the development of new treatments for cancer patients often evaluate the effectiveness of new therapies by reporting the proportion of patients who survive for a specified period of time after completion of the treatment. A new genetic treatment of 1024 patients with a particular type of cancer resulted in 173 patients surviving at least 5 years after treatment. We are interested if this new treatment will result in a survival rate higher than 15% after 5 years Describe the unknown parameter using the context of this study and correct symbol for this parameter State the null and alternative hypothesis for these data Calculate the test Round to four decimal places. Calculate the ?-value for this test (round to four decimal places), then provide a practical conclusion of these resultsThe least-squares regression equation is y=728.0x+14,705 where y is the median income and x is the percentage of 25 years and older with at least a bachelor's degree in the region. The scatter diagram indicates a linear relation between the two variables with a correlation coefficient of 0.8165. For every dollar increase in median income, the percent of adults having at least a bachelor's degree is ___%, on average. For a median income of $0, the percent of adults with a bachelor's degree is ____%.
- Using matlab code and solve this problem please. Use least squares regression to fit polynomials of order 1, 3 and 5 to the data given in table. Compute the correlation coefficient for each fit (Use Gauss elimination with partial pivoting in the solution of linear equation systems). Plot 1st, 3rd, and 5th order polynomial fits and the given discrete data. Comment on which of these curves explain better the variability of given data. xi yi -1.00618 -0.50212 -0.9457 -0.55886 -0.83748 -0.73497 -0.70018 -0.78201 -0.60838 -0.76401 -0.45486 -0.73944 -0.43177 -0.71752 -0.30001 -0.51484 -0.15028 -0.4206 -0.08273 -0.25697 -0.04579 -0.09099 0.142306 0.226821 0.180491 0.377523 0.305722 0.474654 0.42359 0.602706 0.464966 0.77508 0.598916 0.787781 0.675807 0.688962 0.810735 0.651689 0.915424 0.549357 1.040305 0.515353Assume: qi= β0 + β1pi + ui Please derive the estimated values (b0 and b1) based on the equation using OLS (ordinary least squares regression). Show that they are unbiased estimators of β0 and β1.Find the least-squares regression line y^ =b0+b1x through the points (−2,0),(2,6),(5,14),(8,20),(10,26) and then use it to find point estimates y^ corresponding to x=1 and x=8. For x=1, y^ =? For x=8, y^ =?