Question 13 The dot plots show the number of ounces of chocolate in two different trail mixes. 0.5 1.5 2 2.5 0.5 1.5 2. Planters Trail Mix Kirkland Trail Mix Which statement is best supported by the data in the dot plots? The range of the data for Planters Trail mix is greater than the range of the data for Kirkland Trail mix A.
Question 13 The dot plots show the number of ounces of chocolate in two different trail mixes. 0.5 1.5 2 2.5 0.5 1.5 2. Planters Trail Mix Kirkland Trail Mix Which statement is best supported by the data in the dot plots? The range of the data for Planters Trail mix is greater than the range of the data for Kirkland Trail mix A.

Glencoe Algebra 1, Student Edition, 9780079039897, 0079039898, 2018
18th Edition
ISBN:9780079039897
Author:Carter
Publisher:Carter
Chapter10: Statistics
Section10.5: Comparing Sets Of Data
Problem 26PFA

Related questions

Question
Transcribed Image Text:made 2 nours ago by Brandon Hollman
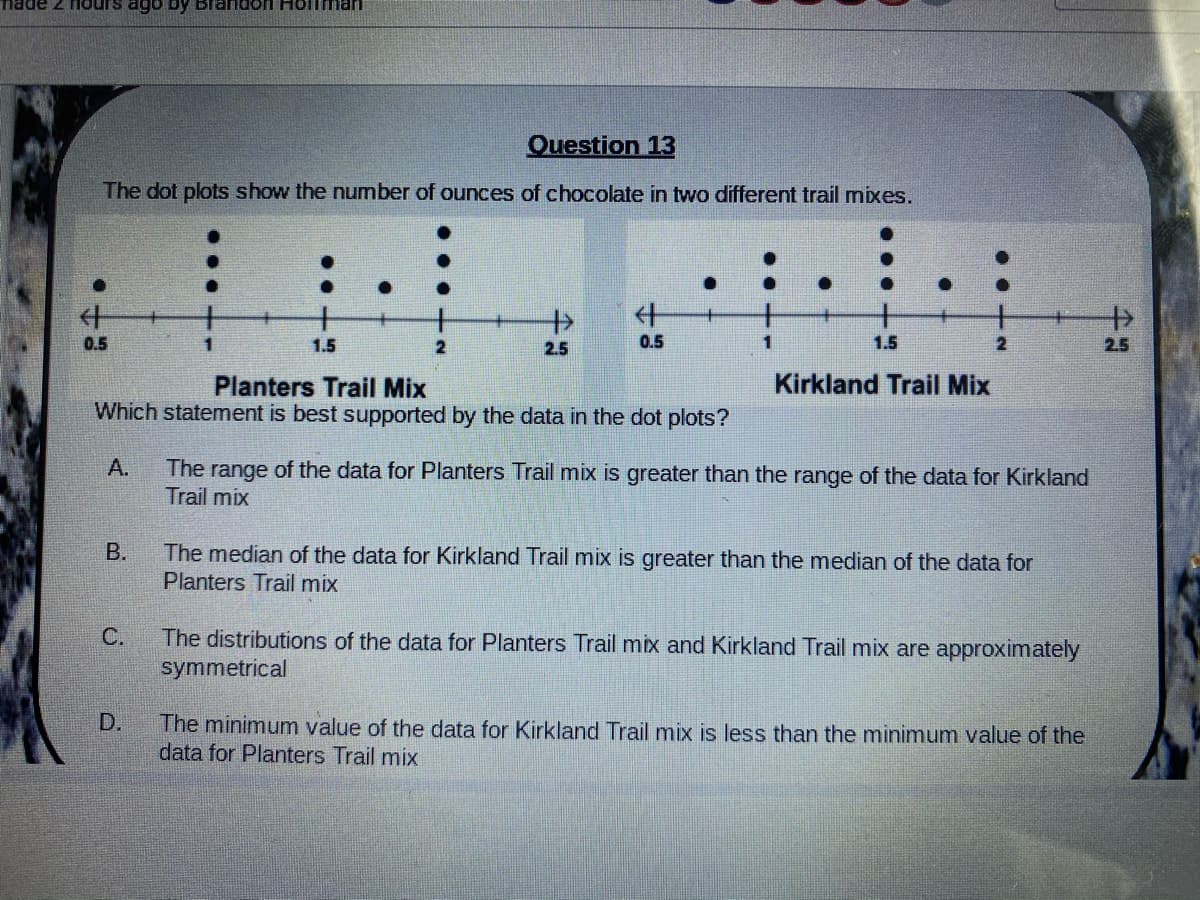
Question 13
The dot plots show the number of ounces of chocolate in two different trail mixes.
什
+
0.5
1.5
2
2.5
0.5
1.
1.5
2.5
Planters Trail Mix
Kirkland Trail Mix
Which statement is best supported by the data in the dot plots?
A.
The range of the data for Planters Trail mix is greater than the range of the data for Kirkland
Trail mix
В.
The median of the data for Kirkland Trail mix is greater than the median of the data for
Planters Trail mix
The distributions of the data for Planters Trail mix and Kirkland Trail mix are approximately
symmetrical
C.
D.
The minimum value of the data for Kirkland Trail mix is less than the minimum value of the
data for Planters Trail mix
Expert Solution
This question has been solved!
Explore an expertly crafted, step-by-step solution for a thorough understanding of key concepts.

Step by step
Solved in 2 steps

Knowledge Booster


Learn more about
Need a deep-dive on the concept behind this application? Look no further. Learn more about this topic, statistics and related others by exploring similar questions and additional content below.Recommended textbooks for you
Glencoe Algebra 1, Student Edition, 9780079039897…
Algebra
ISBN:
9780079039897
Author:
Carter
Publisher:
McGraw Hill

Holt Mcdougal Larson Pre-algebra: Student Edition…
Algebra
ISBN:
9780547587776
Author:
HOLT MCDOUGAL
Publisher:
HOLT MCDOUGAL

Functions and Change: A Modeling Approach to Coll…
Algebra
ISBN:
9781337111348
Author:
Bruce Crauder, Benny Evans, Alan Noell
Publisher:
Cengage Learning
Glencoe Algebra 1, Student Edition, 9780079039897…
Algebra
ISBN:
9780079039897
Author:
Carter
Publisher:
McGraw Hill
Holt Mcdougal Larson Pre-algebra: Student Edition…
Algebra
ISBN:
9780547587776
Author:
HOLT MCDOUGAL
Publisher:
HOLT MCDOUGAL
Functions and Change: A Modeling Approach to Coll…
Algebra
ISBN:
9781337111348
Author:
Bruce Crauder, Benny Evans, Alan Noell
Publisher:
Cengage Learning