QUESTION 16 According to PEW Research Center, 37% of registered voters identify as independents, 33% as Democrats, and 26% as Republicans 4% as other/unknown). We decide to assess our class and get the following data: Independent Democrat Republican Other/Unknown 28 24 Answer the following questions: 1. What is our null hypothesis? a. The observed frequency is different from the expected frequency, meaning that there is a difference in political affiliation among Buffalo State students in PSY306 and the general population. b. The observed frequency is different from the expected frequency, meaning that there is not a difference in political affiliation among Buffalo State students in PSY306 and the general population. c. The observed frequency is not different from the expected frequency, meaning that there is not a difference in political affiliation among Buffalo State students in PSY306 and the general population. d. The observed frequency is not different from the expected frequency, meaning that there is a difference in political affiliation among Buffalo State students in PSY306 and the general population. 2. What is the alternative hypothesis a. The observed frequency is different from the expected frequency, meaning that there is a difference in political affiliation among Buffalo State students in PSY306 and the general population. b. The observed frequency is different from the expected frequency, meaning that there is not a difference in political affiliation among Buffalo State students in PSY306 and the general population. c. The observed frequency is not different from the expected frequency, meaning that there is not a difference in political affiliation among Buffalo State students in PSY306 and the general population. d. The observed frequency is not different from the expected frequency, meaning that there is a difference in political affiliation among Buffalo State students in PSY306 and the general population. 3. Fill in the expected frequencies for the following: Independent Democrat Republican Other/Unknown
QUESTION 16 According to PEW Research Center, 37% of registered voters identify as independents, 33% as Democrats, and 26% as Republicans 4% as other/unknown). We decide to assess our class and get the following data: Independent Democrat Republican Other/Unknown 28 24 Answer the following questions: 1. What is our null hypothesis? a. The observed frequency is different from the expected frequency, meaning that there is a difference in political affiliation among Buffalo State students in PSY306 and the general population. b. The observed frequency is different from the expected frequency, meaning that there is not a difference in political affiliation among Buffalo State students in PSY306 and the general population. c. The observed frequency is not different from the expected frequency, meaning that there is not a difference in political affiliation among Buffalo State students in PSY306 and the general population. d. The observed frequency is not different from the expected frequency, meaning that there is a difference in political affiliation among Buffalo State students in PSY306 and the general population. 2. What is the alternative hypothesis a. The observed frequency is different from the expected frequency, meaning that there is a difference in political affiliation among Buffalo State students in PSY306 and the general population. b. The observed frequency is different from the expected frequency, meaning that there is not a difference in political affiliation among Buffalo State students in PSY306 and the general population. c. The observed frequency is not different from the expected frequency, meaning that there is not a difference in political affiliation among Buffalo State students in PSY306 and the general population. d. The observed frequency is not different from the expected frequency, meaning that there is a difference in political affiliation among Buffalo State students in PSY306 and the general population. 3. Fill in the expected frequencies for the following: Independent Democrat Republican Other/Unknown

College Algebra (MindTap Course List)
12th Edition
ISBN:9781305652231
Author:R. David Gustafson, Jeff Hughes
Publisher:R. David Gustafson, Jeff Hughes
Chapter8: Sequences, Series, And Probability
Section8.7: Probability
Problem 58E: What is meant by the sample space of an experiment?

Related questions

Question
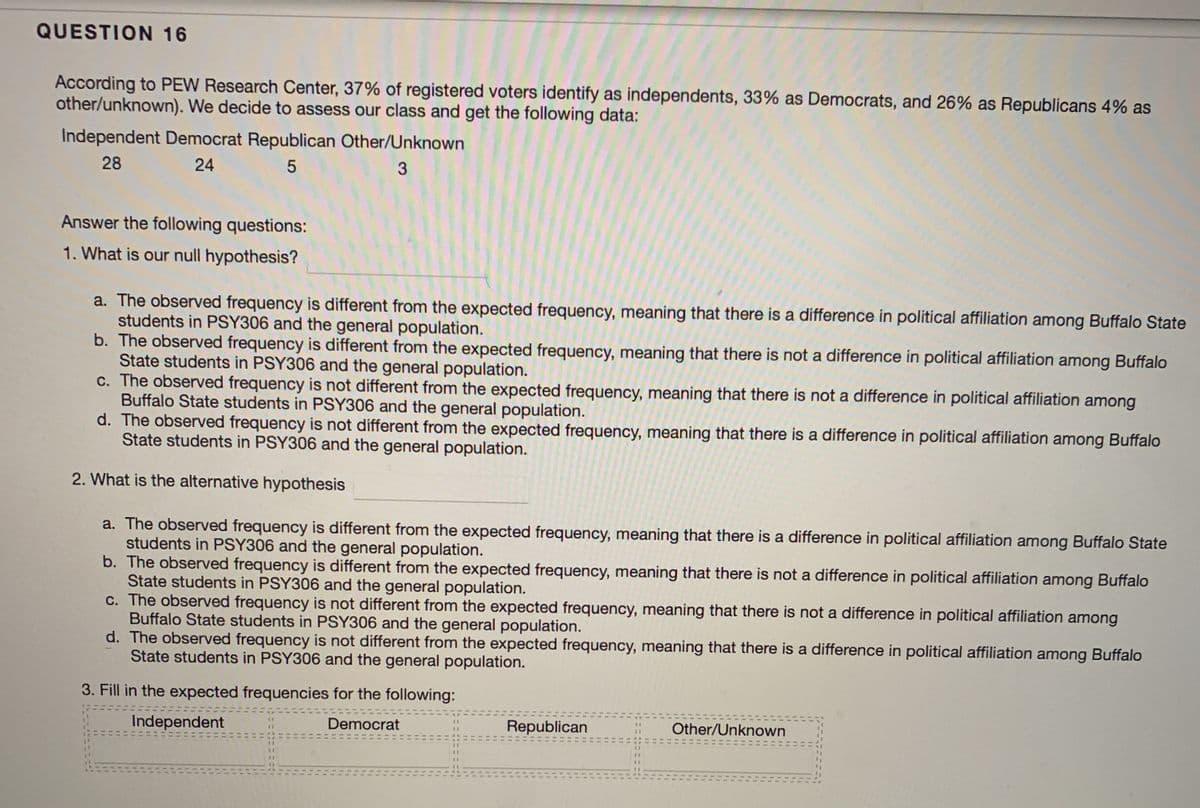
Transcribed Image Text:QUESTION 16
According to PEW Research Center, 37% of registered voters identify as independents, 33% as Democrats, and 26% as Republicans 4% as
other/unknown). We decide to assess our class and get the following data:
Independent Democrat Republican Other/Unknown
28
24
3.
Answer the following questions:
1. What is our null hypothesis?
a. The observed frequency is different from the expected frequency, meaning that there is a difference in political affiliation among Buffalo State
students in PSY306 and the general population.
b. The observed frequency is different from the expected frequency, meaning that there is not a difference in political affiliation among Buffalo
State students in PSY306 and the general population.
c. The observed frequency is not different from the expected frequency, meaning that there is not a difference in political affiliation among
Buffalo State students in PSY306 and the general population.
d. The observed frequency is not different from the expected frequency, meaning that there is a difference in political affiliation among Buffalo
State students in PSY306 and the general population.
2. What is the alternative hypothesis
a. The observed frequency is different from the expected frequency, meaning that there is a difference in political affiliation among Buffalo State
students in PSY306 and the general population.
b. The observed frequency is different from the expected frequency, meaning that there is not a difference in political affiliation among Buffalo
State students in PSY306 and the general population.
c. The observed frequency is not different from the expected frequency, meaning that there is not a difference in political affiliation among
Buffalo State students in PSY306 and the general population.
d. The observed frequency is not different from the expected frequency, meaning that there is a difference in political affiliation among Buffalo
State students in PSY306 and the general population.
3. Fill in the expected frequencies for the following:
Independent
Democrat
Republican
Other/Unknown
11
Expert Solution
This question has been solved!
Explore an expertly crafted, step-by-step solution for a thorough understanding of key concepts.

Step by step
Solved in 4 steps

Knowledge Booster


Learn more about
Need a deep-dive on the concept behind this application? Look no further. Learn more about this topic, statistics and related others by exploring similar questions and additional content below.Recommended textbooks for you
College Algebra (MindTap Course List)
Algebra
ISBN:
9781305652231
Author:
R. David Gustafson, Jeff Hughes
Publisher:
Cengage Learning
College Algebra (MindTap Course List)
Algebra
ISBN:
9781305652231
Author:
R. David Gustafson, Jeff Hughes
Publisher:
Cengage Learning